
A significant inflection point for small-cap stocks

Key points:
- The distance from a 2-year high spread between small and large-cap indexes widened to a historic level
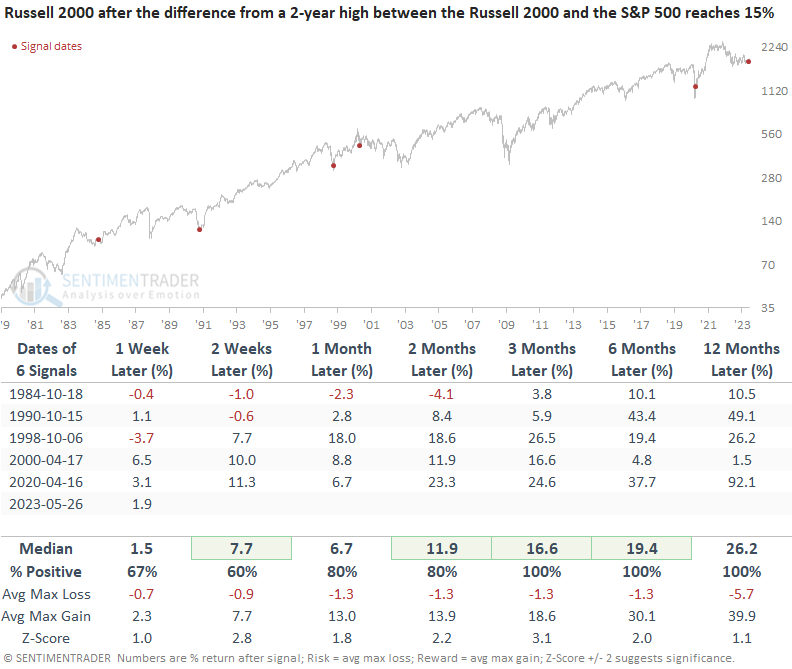
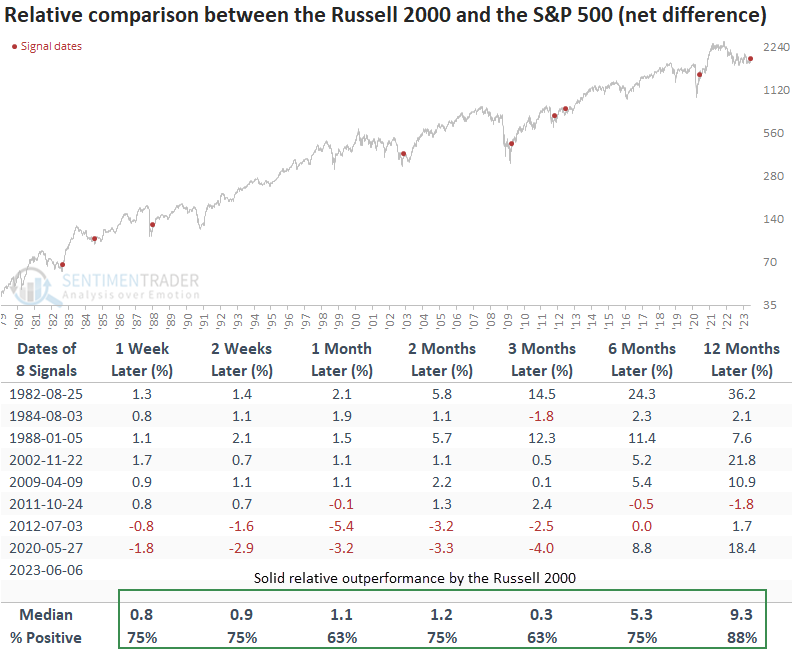
- After similar disconnects, the Russell 2000 was higher from three to twelve months later every time
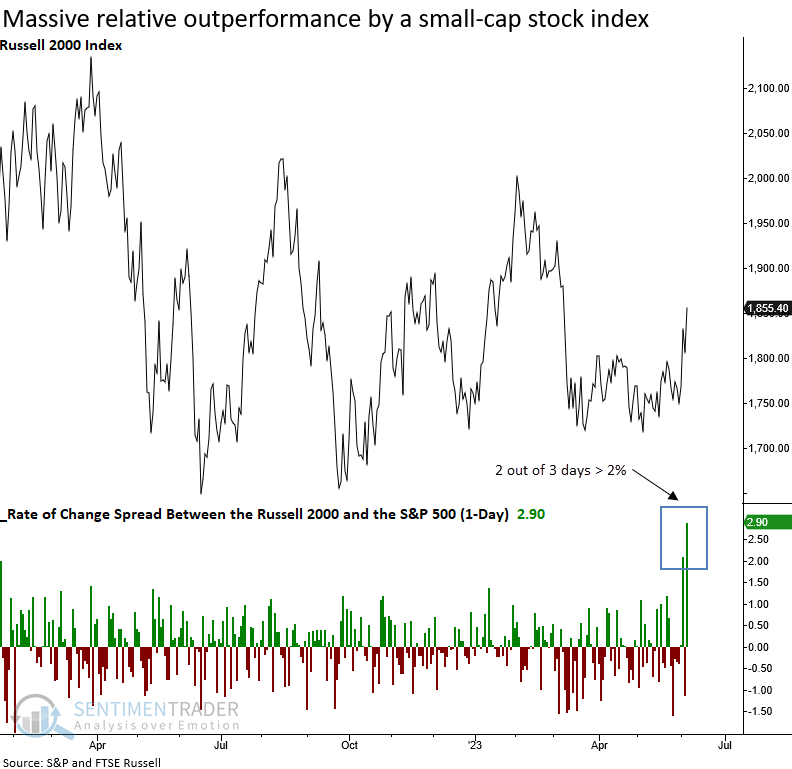
- Several price momentum and breakout signals triggered with bullish implications for the Russell 2000
The weight of the evidence suggests a catch-up trade for small-cap stocks
The Russell 2000, a small-capitalization stock index, has underperformed the S&P 500 since the market low last October, which is unusual. Typically, small caps outperform in the initial stages of a new uptrend.
In the last week, evidence has emerged that suggests the tide could be turning in favor of a catch-up trade in small stocks.
The disconnect between small and large-cap indexes is one of the most significant in history. For only the 6th time in 40 years, the distance from a 2-year high spread between the Russell 2000 and the S&P 500 widened to 15%.
The previous uncoupling occurred in April 2020 when uncertainty around Covid left small caps in the dust as investors crowded into the relative safety of mega-cap Technology stocks. Of course, the dilemma now centers around the regional bank crisis and the economy.
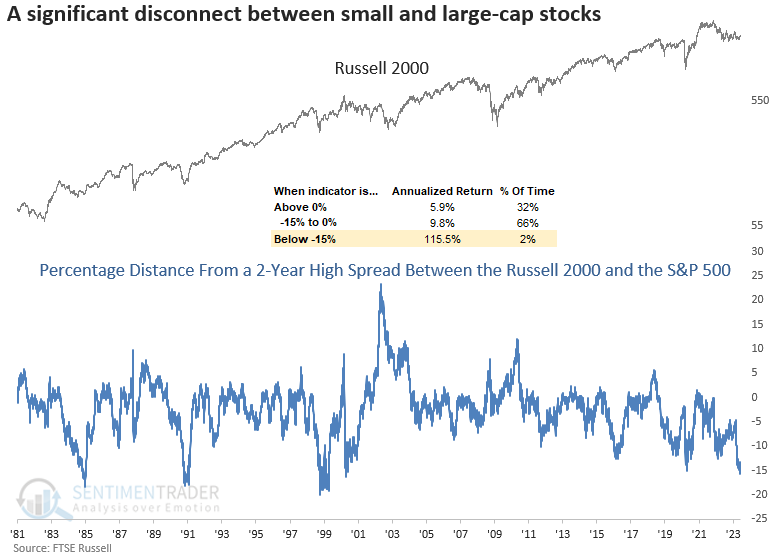
The distance from a 2-year high spread reached its maximum on 2023-06-01 when the Russell 2000 closed 27.62% below its 2-year high, while the S&P 500 closed 12% below its respective high.
Similar disconnects between small and large stocks occurred near turning points
While rare, small-cap stocks rip higher when the distance from a 2-year high spread between the Russell 2000 and the S&P 500 widens to 15%. Except for April 2000, the disconnect marked a significant inflection point for stocks near market lows. If you think the current signal is an analog for the Dotcom precedent, remember that the Russell 2000 had a max gain of 18.6% over the next three months after that alert.
Bullish momentum and breakout signals are now triggering alerts
The Russell 2000 outperformed the S&P 500 by over 2% on 2023-06-02 and 2023-06-06. When I searched for other precedents, I found only two other instances since 1980. So, I lowered the threshold to 1.5% to increase the sample size.
Similar relative performance patterns preceded excellent results
When the Russell 2000 outperformed the S&P 500 by 1.5% in two out of three days, with the pause in the middle, the small-cap index was higher two and three months later in all but one case. That instance occurred in 2008, just after the Lehman bankruptcy, when markets were in freefall, which is at odds with the current environment.
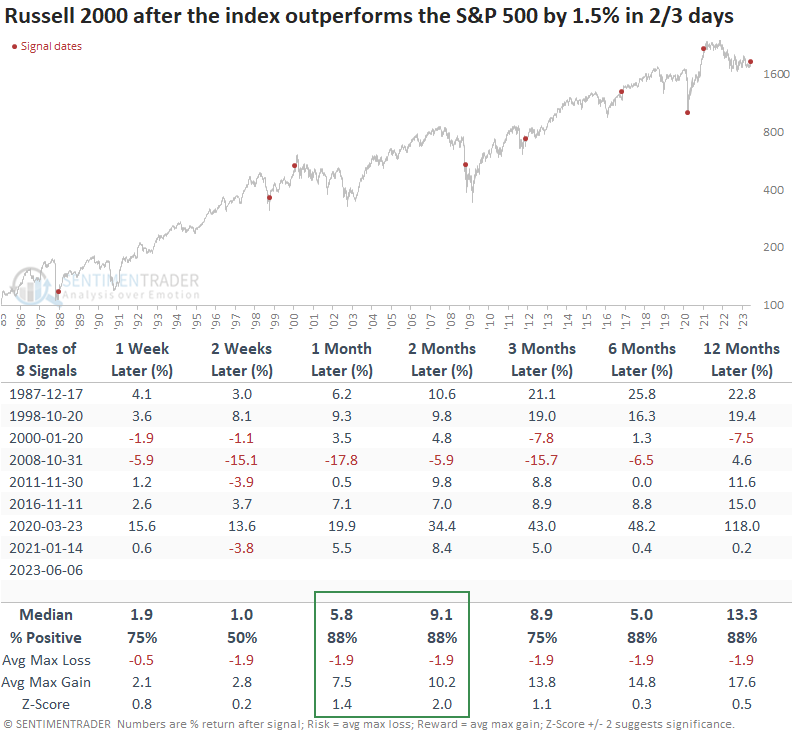
Over the next two months, the max gain exceeded the max loss in 7 out of 8 cases.
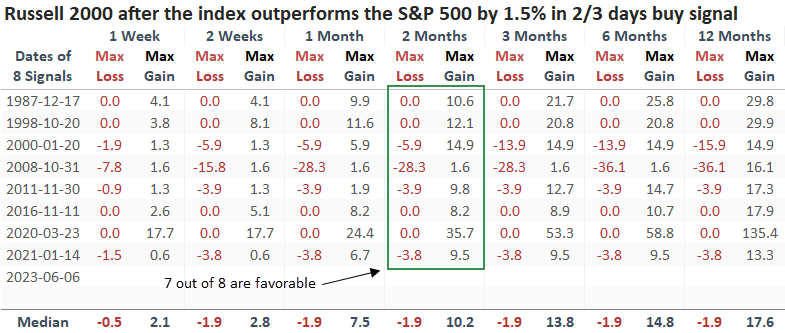
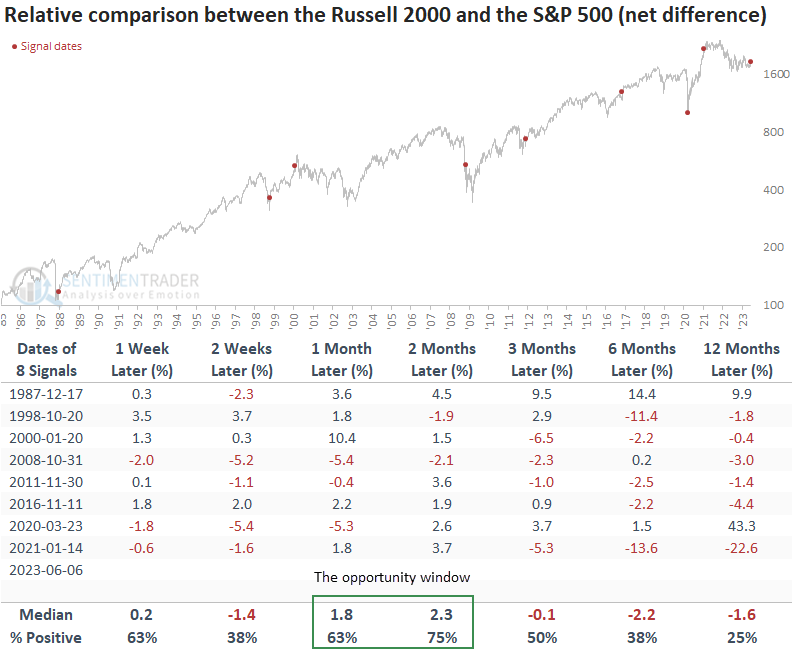
When I compare the Russell 2000 to the S&P 500, the window of opportunity for relative outperformance by small-caps falls in the one to two-month horizon.
An additional bullish pattern
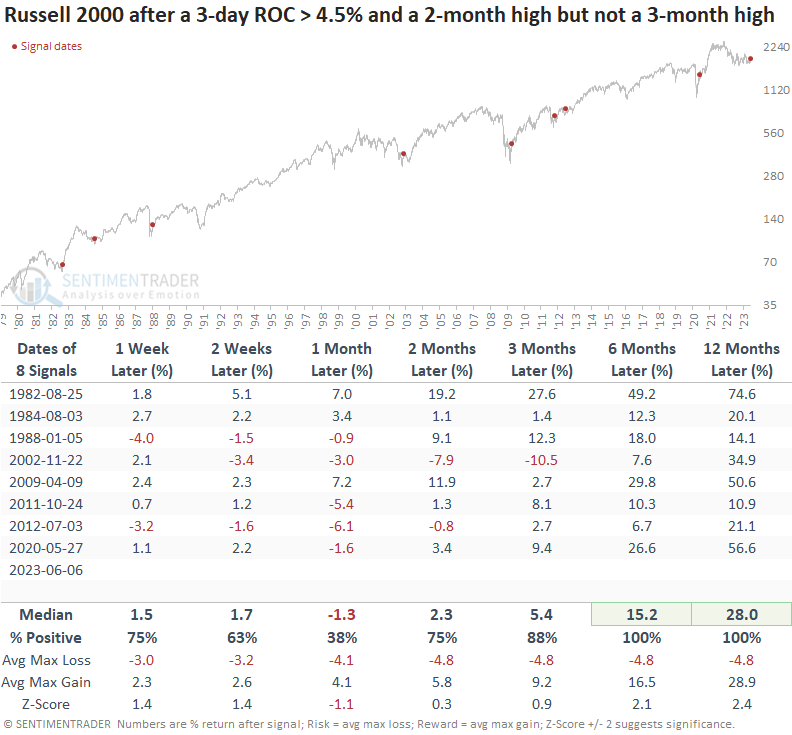
The Russell 2000 surged by more than 4.5% over the last three days and closed at a 2-month high but not a 3-month high.
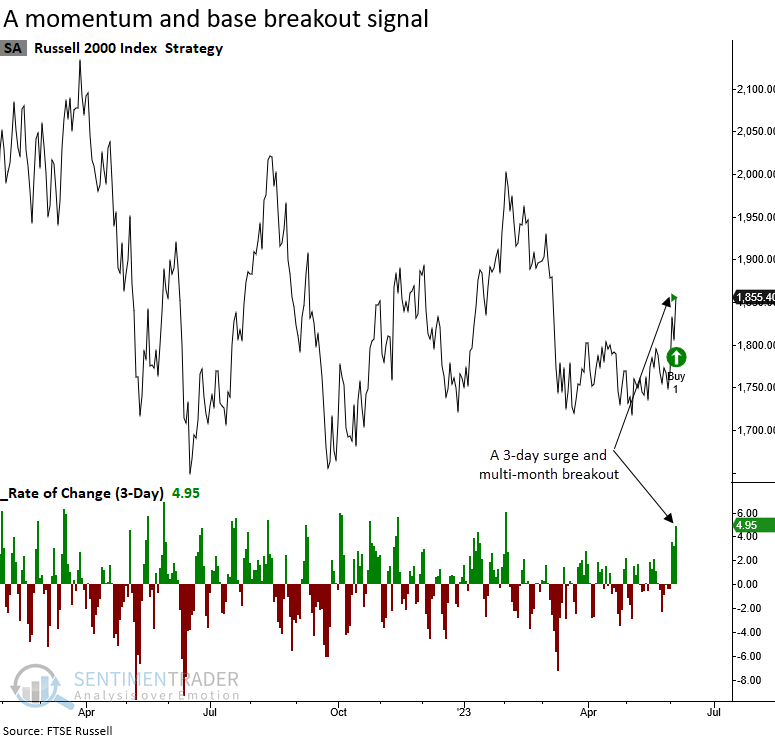
A surge in price momentum accompanied by a base breakout tends to occur near significant long-term inflection points for small-cap stocks. Six and twelve months later, the Russell 2000 was higher every time.
A comparison between the Russell 2000 and the S&P 500 suggests the small-cap index could outperform.
What the research tells us...
The disconnect between small and large-cap indexes reached one of the most significant degrees in history. When the distance from a 2-year high spread between the Russell 2000 and the S&P 500 expands to 15%, the Russell 2000 rallied over the next three to twelve months every time. With several short-term price-based patterns triggering an alert, the weight of the evidence suggests a catch-up trade in small caps looks favorable.