Data &
Technology
Research
Reports
Report Solutions
Reports Library
Actionable
Strategies
Free
Resources
Simple Backtest Calculator
Simple Seasonality Calculator
The Kelly Criterion Calculator
Sentiment Geo Map
Public Research Reports
Free Webinar
Pricing
Company
About
Meet Our Team
In the News
Testimonials
Client Success Stories
Contact
Log inLoginSign up
< BACK TO ALL REPORTS

A significant downward shift in the Risk On/Off Indicator
Dean Christians
2023-08-17
The SentimenTrader Risk On/Off Indicator, a composite that measures the percentage of indicators considered to be risk-on, declined by more than 25% over three trading sessions. After similar downshifts, the S&P 500 struggled over the next three weeks.

Key points:

  • The SentimenTrader Risk On/Off Indicator declined by 25% over three trading sessions
  • Similar shifts in the composite led to weak returns for the S&P 500 over the next three weeks
  • Defensive sectors tend to outperform other groups under similar conditions

Sharp and sudden shifts in indicators provide useful insights 

Stocks continue to drift lower in an orderly manner after a solid start to the year. As I discussed in a note a few weeks ago, the breakout in rates suggested stocks could consolidate/correct. That was especially the case during FOMC tightening cycles. 

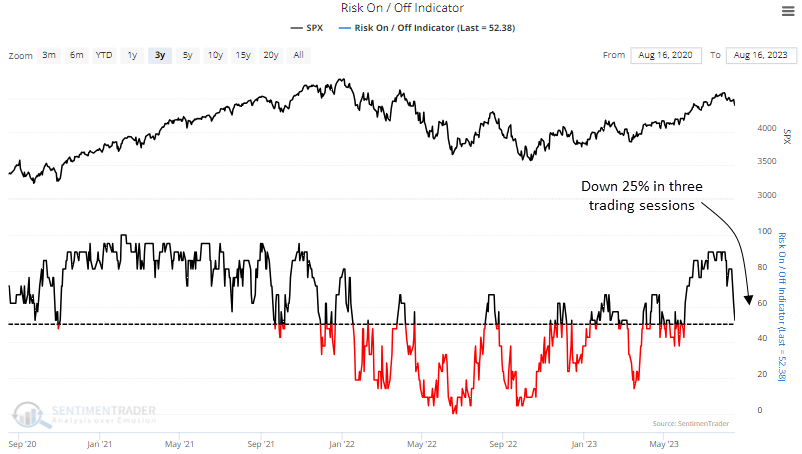
With stocks retreating, the SentimenTrader Risk On/Off Indicator contracted meaningfully over the last three trading sessions.

The model, a composite that measures the percentage of indicators considered to be risk-on, declined by more than 25%. 

For context, I established a rule that required the indicator to surpass the 90% threshold before a new alert could trigger again. Additionally, I stipulated that the composite must be under 55%, ensuring similar conditions to the current signal.

Similar swift contractions in the Risk On/Off indicator suggest stocks struggle

Whenever the Risk-On/Off indicator saw a 25% decline over three consecutive trading sessions, the S&P 500 typically faced challenges in the immediate future. The weakness was especially pronounced three days later, with the world's most benchmarked index declining 70% of the time.

An assessment to determine the ideal number of days to hold a short position in the S&P 500 based on the signal conditions returned an optimal holding period of 14 trading days, emphasizing the short-term nature of the alert.
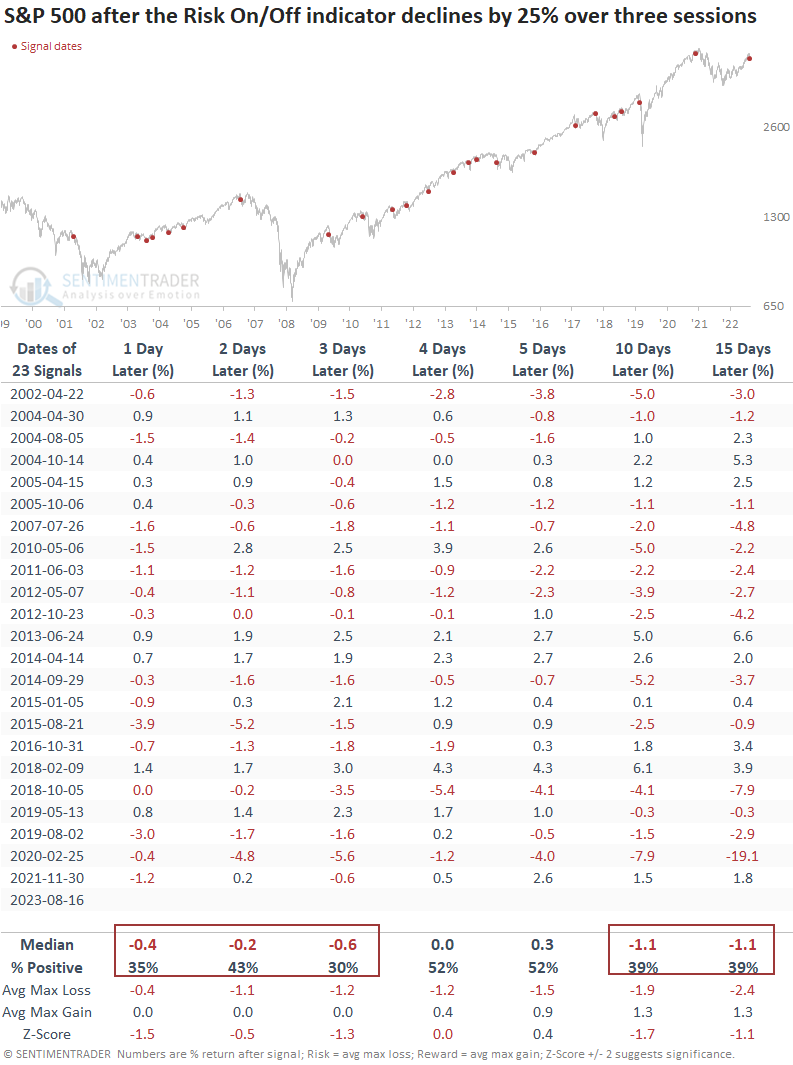
It's important to remember that the signal required a reset above 90%, a level associated with uptrends in stocks. Because of this condition, the alert typically occurs within the context of a bull market correction.

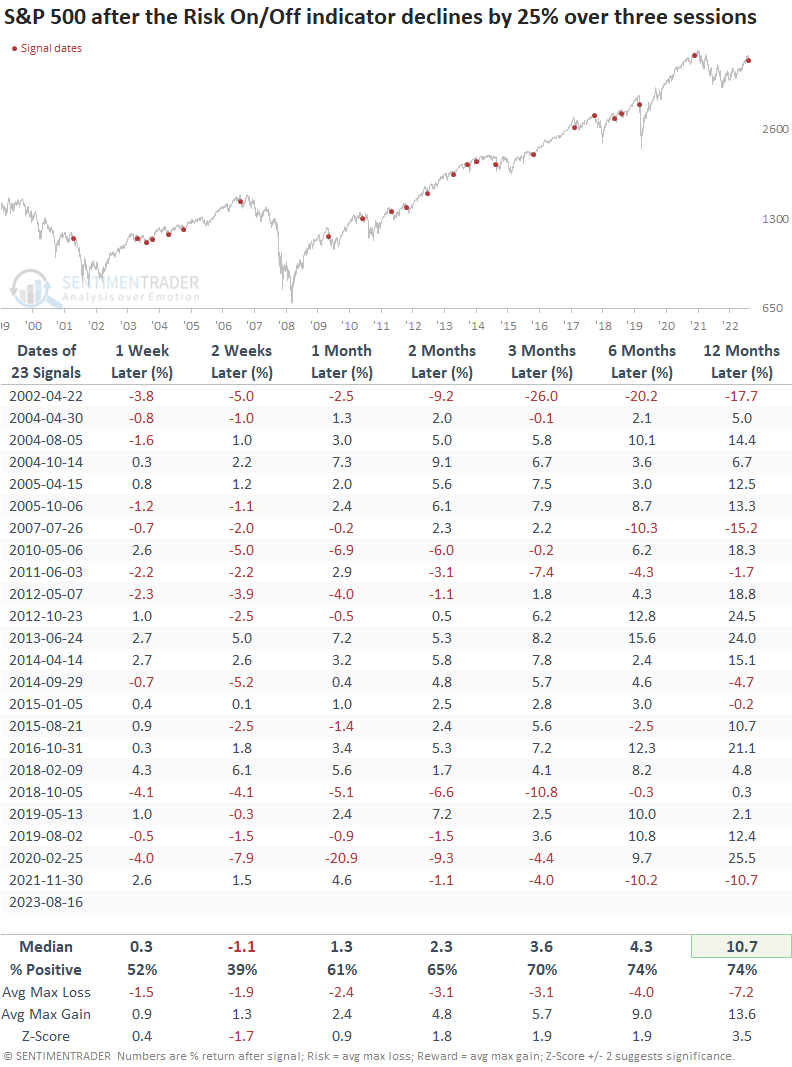
From two to twelve months later, S&P 500 returns were above the average return over the study period.
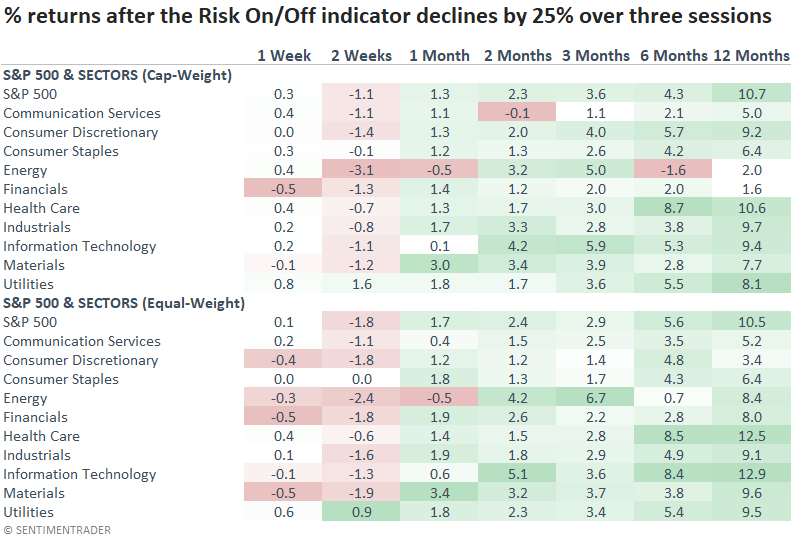
Not surprisingly, defensive sectors like Consumer Staples and Utilities outperform other sectors over the next few weeks, in line with their historical behavior in drawdowns. 
What the research tells us...

A significant number of components in the Risk On/Off Indicator deteriorated, causing the composite to fall over 25% in only three sessions. Similar downshifts tend to produce weak returns for the S&P 500 over the next three weeks, with the worst outlook occurring only a few days later. With constructive long-term results that exceed the average return over the study period, traders should patiently wait for the correction to play out.

Sorry, you don't have access to this report

Upgrade your subscription plan to get access
Go to Dasboard
DATA &
TECHnologies
IndicatorEdge
‍
BackTestEdge
‍
Other Tools
‍
DataEdge API
RESEARCH
reports
Research Solution
‍
Reports Library
‍
actionable
Strategies
Trading Strategies
‍
Smart Stock Scanner
‍
FREE
RESOUrCES
Simple Backtest
Calculator
Simple Seasonality
Calculator
The Kelly Criterion
Calculator
Sentiment Geo Map
‍
Public Research Reports
‍
Free Webinar
COMPANY
‍
About
‍
Meet our Team
‍
In the News
‍
Testimonials
‍
Client Success Stories
Pricing
Bundle pricing
‍
Announcements
‍
FAQ
© 2024 Sundial Capital Research Inc. All rights reserved.
Setsail Marketing
TermsPrivacyAffiliate Program
Risk Disclosure: Futures and forex trading contains substantial risk and is not for every investor. An investor could potentially lose all or more than the initial investment. Risk capital is money that can be lost without jeopardizing ones’ financial security or life style. Only risk capital should be used for trading and only those with sufficient risk capital should consider trading. Past performance is not necessarily indicative of future results.

Hypothetical Performance Disclosure: Hypothetical performance results have many inherent limitations, some of which are described below. No representation is being made that any account will or is likely to achieve profits or losses similar to those shown; in fact, there are frequently sharp differences between hypothetical performance results and the actual results subsequently achieved by any particular trading program. One of the limitations of hypothetical performance results is that they are generally prepared with the benefit of hindsight. In addition, hypothetical trading does not involve financial risk, and no hypothetical trading record can completely account for the impact of financial risk of actual trading. for example, the ability to withstand losses or to adhere to a particular trading program in spite of trading losses are material points which can also adversely affect actual trading results. There are numerous other factors related to the markets in general or to the implementation of any specific trading program which cannot be fully accounted for in the preparation of hypothetical performance results and all which can adversely affect trading results.

Testimonial Disclosure: Testimonials appearing on this website may not be representative of other clients or customers and is not a guarantee of future performance or success.