
A significant divergence has emerged between stocks, crude oil, and bonds

Key points:
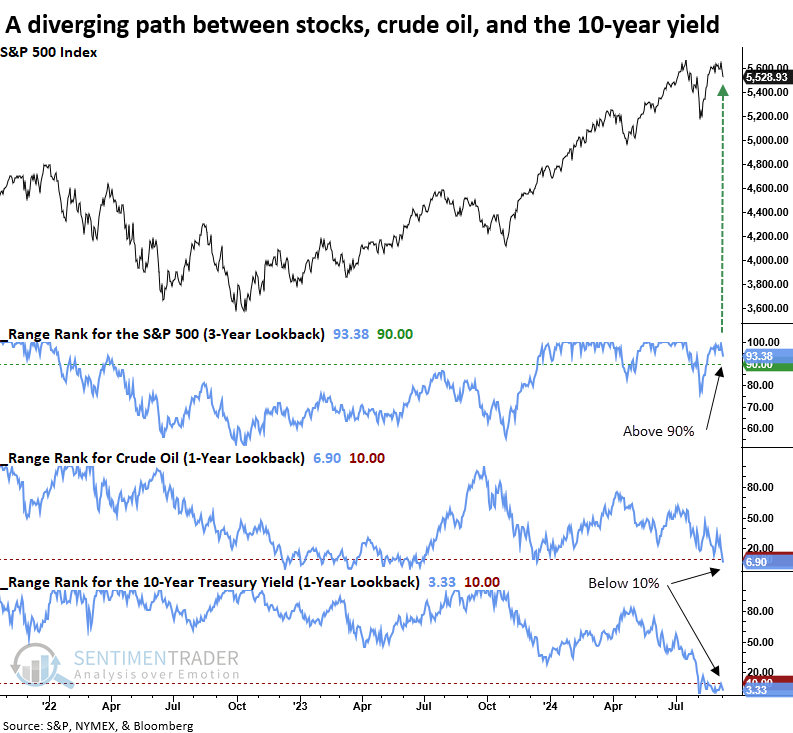
- Stocks, crude oil, and the 10-year Treasury yield are showing a marked divergence in their trends
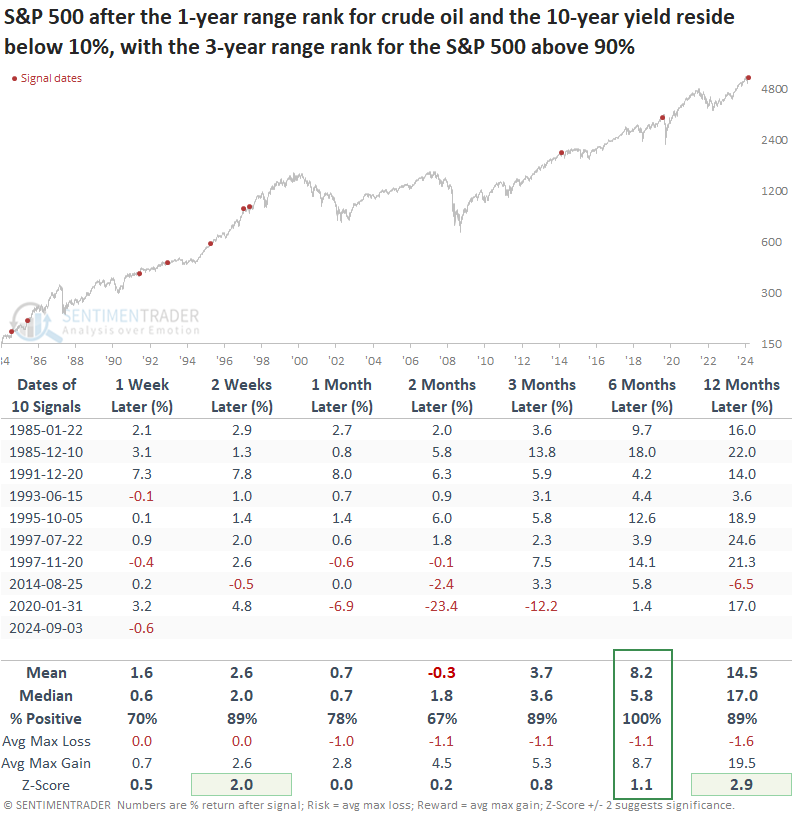
- Similar precedents preceded a 100% win rate for the S&P 500 over the subsequent six months
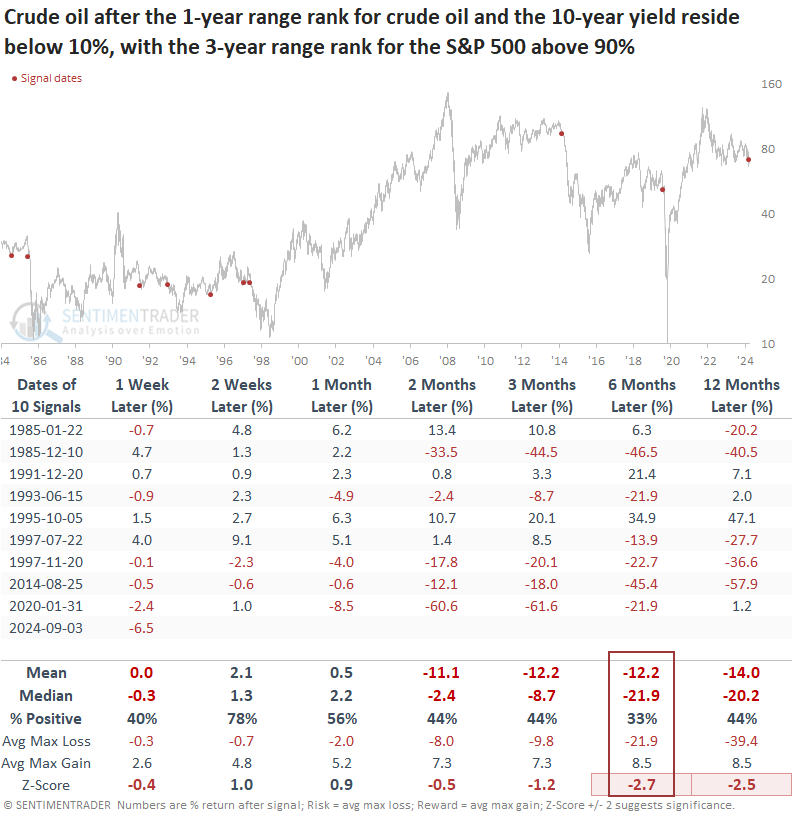
- Crude oil and long-dated yields could see additional downside, providing a tailwind for consumer sectors
As stocks flirt with record highs, two critical business cycle inputs hover near annual lows
While browsing Fintwit last week, the following comments, which will remain anonymous, caught my attention.
"The market has been pricing equities like we are going to have a soft landing but pricing oil like we are heading for a depression. Both of these cannot be correct." Another commentator responded by saying, "Bonds too."
As usual, the remarks lacked proof to validate concerns that oil and interest rates are flashing economic warnings while stocks remain oblivious.
Although I highlighted breakdowns in crude oil and interest rates in separate research reports, the above comments made me wonder: when have we seen stocks near a multi-year high with crude oil and interest rates simultaneously near an annual low?
To identify the first instance, I required the range rank for crude oil to exceed 50% before a new signal could trigger again.
Similar divergences preceded outstanding returns for the S&P 500 over the subsequent year
Whenever the S&P 500 resided near the upper end of its 3-year range, with crude oil and the 10-year yield hovering near the bottom end of their respective 1-year ranges, stocks posted solid gains fueled by more favorable energy prices and borrowing costs.
Over the subsequent six months, the world's most benchmarked index rallied 100% of the time.
While the sample size is small, most signals occurred in the 1990s, an era frequently described as a "Goldilocks" period.
Although a near-term rebound in crude oil is possible, similar precedents suggest the commodity should trend lower over the following two to twelve months, boosting disposable income and potentially consumer spending.
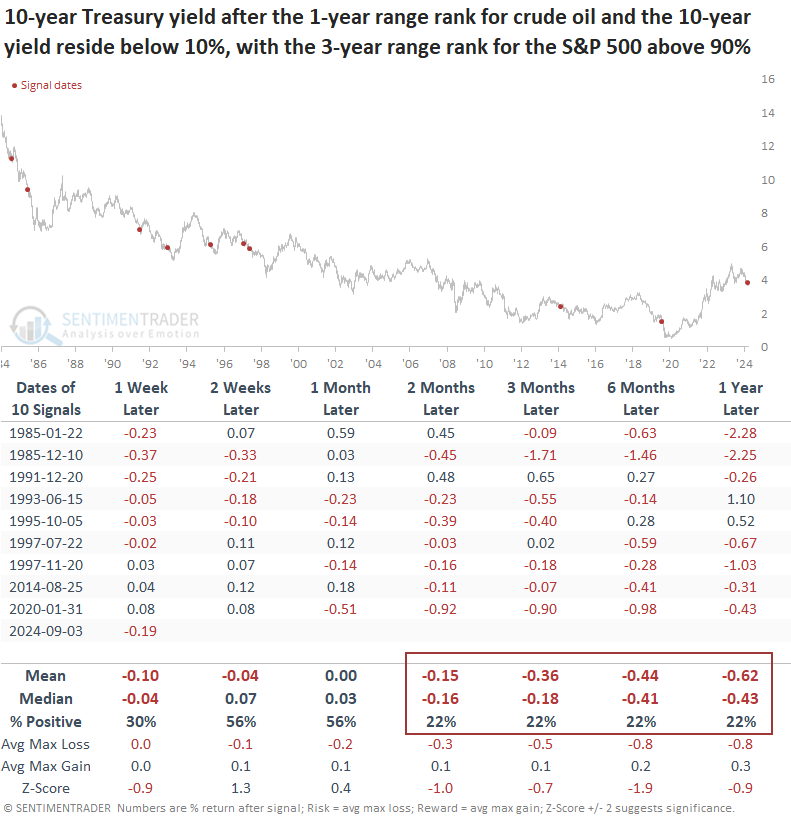
Following similar divergences, the 10-year Treasury yield, commonly used as a proxy for mortgage rates, displayed a solid tendency to decline, falling 78% of the time from two to twelve months later.
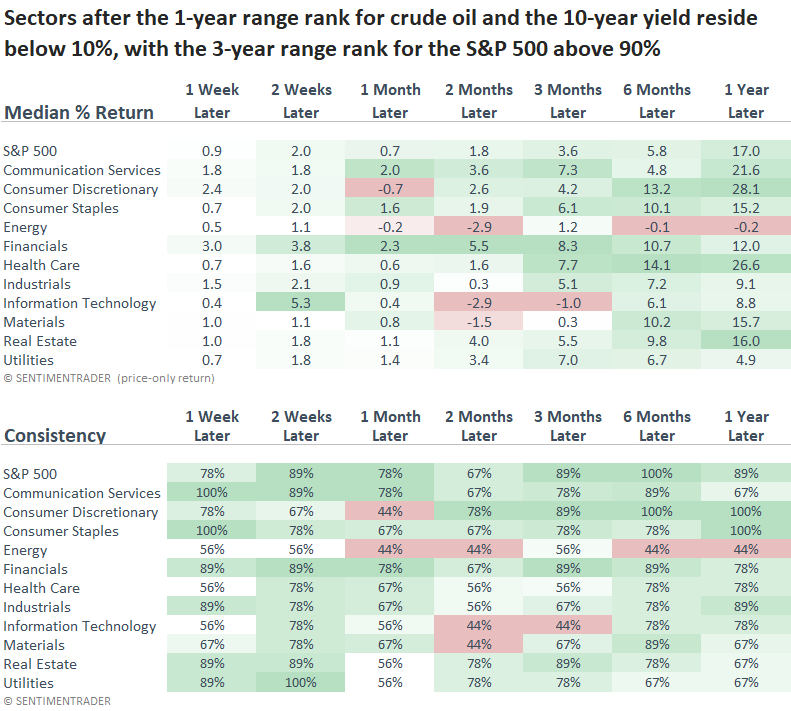
Don't count the consumer out
An easing in oil and rates should benefit consumer-oriented sectors the most. Following similar conditions, the Consumer Discretionary sector outperformed the S&P 500 from two to twelve months later. Furthermore, it was the top-performing group one year later.
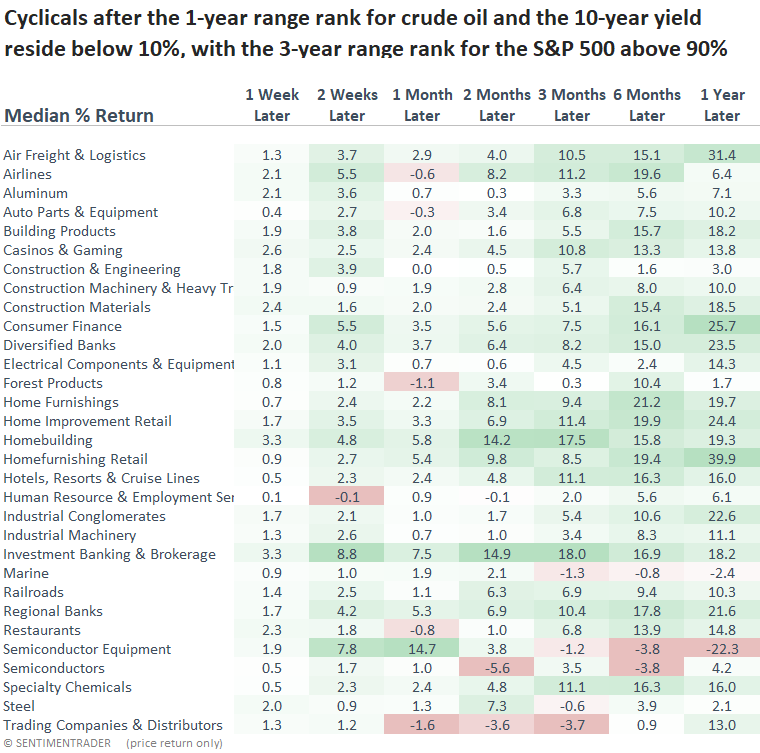
Cyclical sub-industry groups, notably those geared toward the housing sector, experienced exceptional returns over the next year. Lower oil prices increase disposable income by cutting fuel and utility costs, while reduced interest rates enhance affordability for homebuyers and incentivize broader consumer spending across various goods and services.
What the research tells us...
When crude oil and the 10-year Treasury yield approach annual lows in unison while stocks hover near highs, investors who trusted the market message from equities have historically reaped the rewards. A more worrisome concern arises when all three assets decline in tandem. Lower energy costs and reduced borrowing expenses create an economic stimulus that fuels stock prices higher. Following similar precedents, the S&P 500 rallied 100% of the time over the subsequent six months. Unsurprisingly, consumer-oriented sectors and industries outperformed.
From a big-picture perspective, the decline in oil prices and interest rates should act as a bullish catalyst for equities. However, seasonality, the Fed, and the upcoming election will likely keep the market range-bound in the short term.