
A signal that suggests a cautionary stance for the technology group

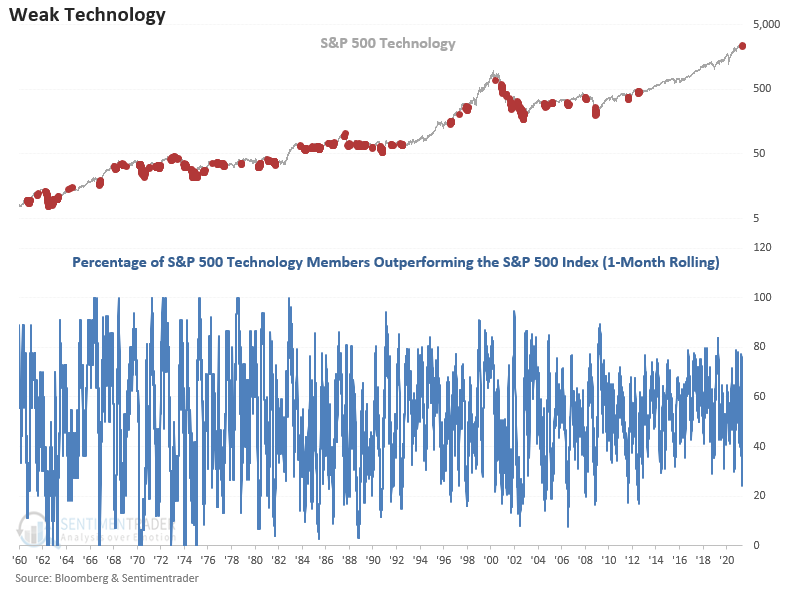
The percentage of S&P 500 Technology members outperforming the S&P 500 index on a rolling 1-month basis dropped to the lowest level since July 2012. Given that it's been almost nine years since the last reading at this level, and according to the April BofA global fund manager survey, technology remains the most crowded trade, we need to investigate further.
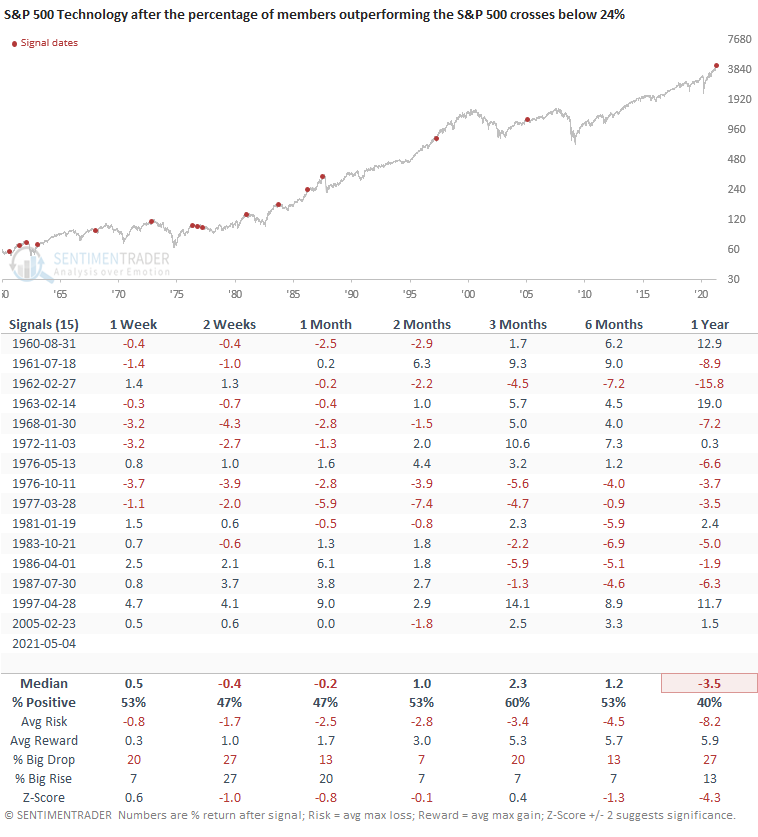
Let's review what happens to technology when the percentage of members outperforming the S&P 500 index crosses below 24%.
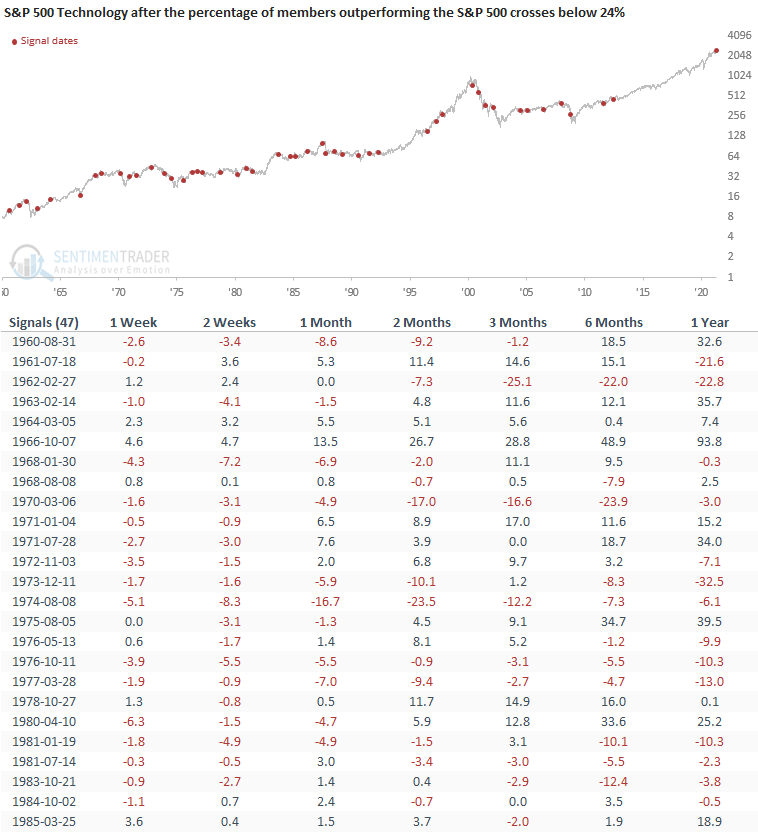
HISTORICAL CHART INSTANCES <= 24%
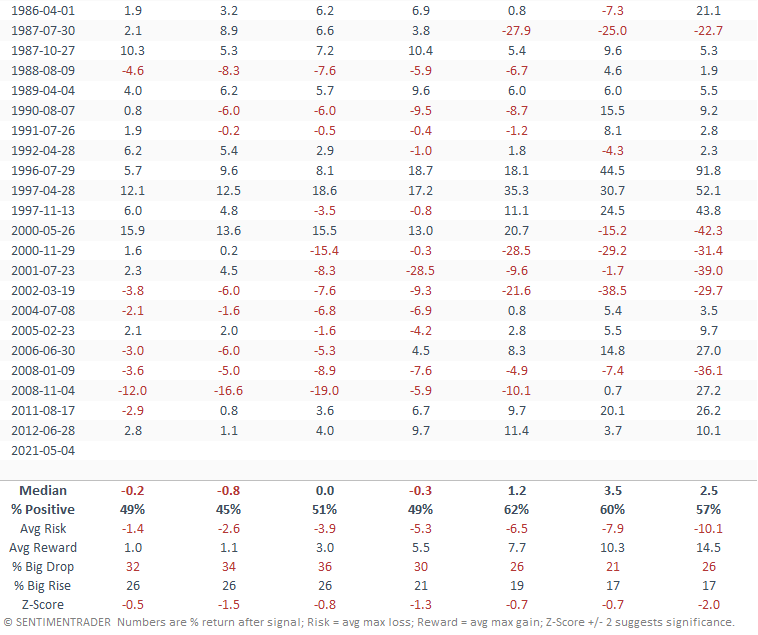
HOW THE SIGNALS PERFORMED
Performance looks weak across all timeframes with a notable z-score 1-year forward.
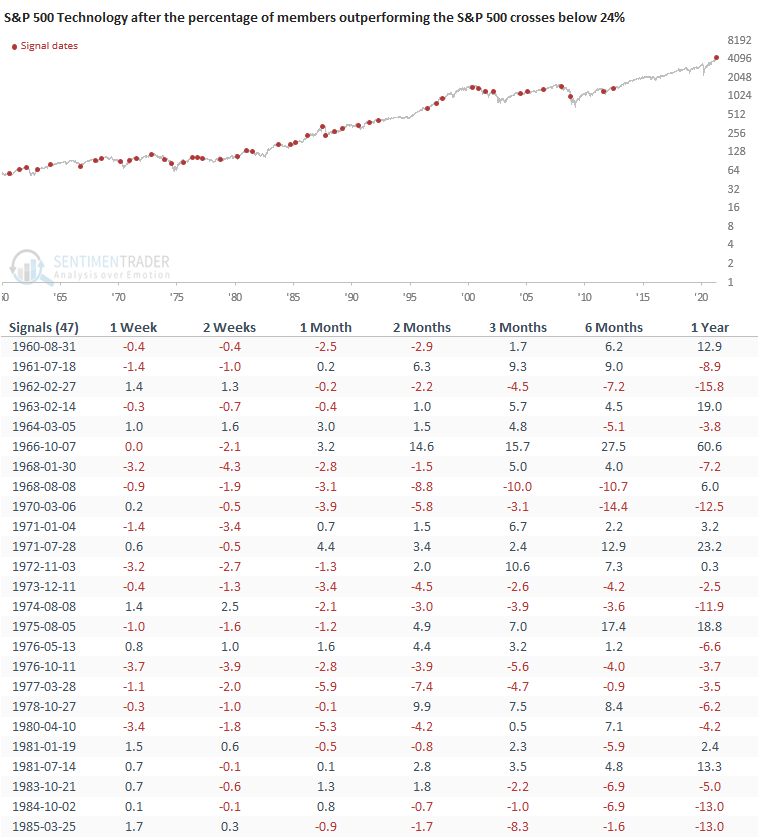
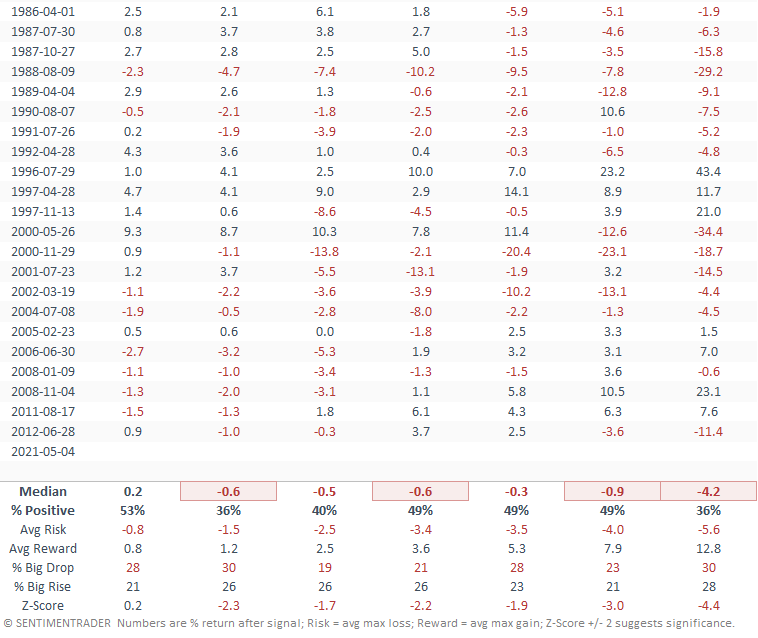
HOW THE SIGNALS PERFORMED RELATIVE TO S&P 500
Relative performance looks weak across all timeframes with several notable z-scores.
The most recent signal occurred when technology was down 4.72% from its most recent high. Let's isolate all instances when the sector was down 10% or less.
HOW THE SIGNALS PERFORMED - INSTANCES WITHIN 10% OF HIGH
The absolute performance continues to exhibit weak results, especially in the one-year timeframe.

HOW THE SIGNALS PERFORMED RELATIVE TO S&P 500 - INSTANCES WITHIN 10% OF HIGH
The relative performance continues to exhibit weak results, especially in the one-year timeframe.
The message from the market on technology is one of caution. Does this mean that we should run out and sell all of our technology holdings? I suspect not. However, we need to be mindful that technology may be a market laggard for now. As always, one signal does not make a trend. I will be monitoring the group for additional warnings.