
A short-term breadth washout and initial recovery

On Monday and Wednesday, selling pressure was overwhelming enough that most securities fell, and most of the volume on the NYSE was focused on those issues.
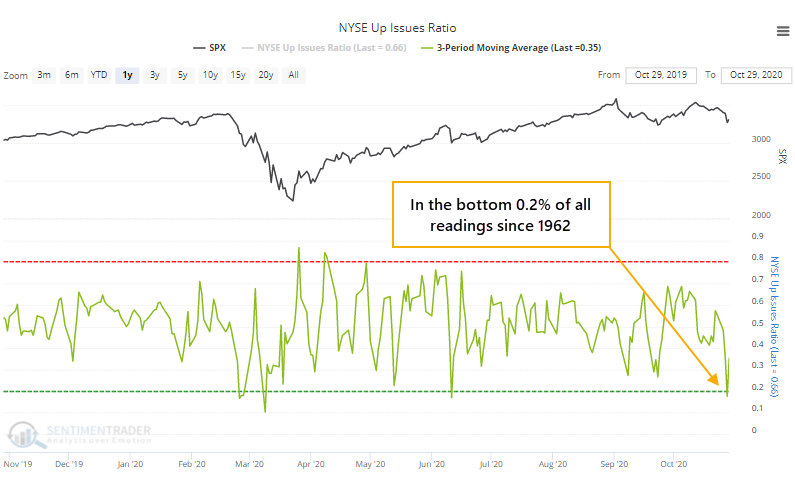
The 3-day average of NYSE Up Issues and Up Volume both dropped to below 20%. That shows wholesale, get-me-out selling pressure. Often, we'll see a lot of down issues, but maybe not a lot of volume. Or maybe there will be a lot of volume flowing into relatively few declining stocks.
Earlier this week, it was both. The 3-day average of NYSE Up Issues dropped to within the lowest 0.2% of all readings since 1962.

Up Volume fell to within the lowest 0.4% of all readings.
Thursday's rebound was enough to push those average back above 20%, showing a potential recovery, though longer-term measures haven't reached oversold yet and Friday's activity will change this somewhat.
It's not all that unusual to see extremely depressed breadth over a multi-day period during a bear market. It's rarer to see it when stocks have been holding up fairly well. Below, we can see every time the 3-day average of both Up Issues and Up Volume rose above 20% while the S&P 500 was above its 200-day moving average at the time.
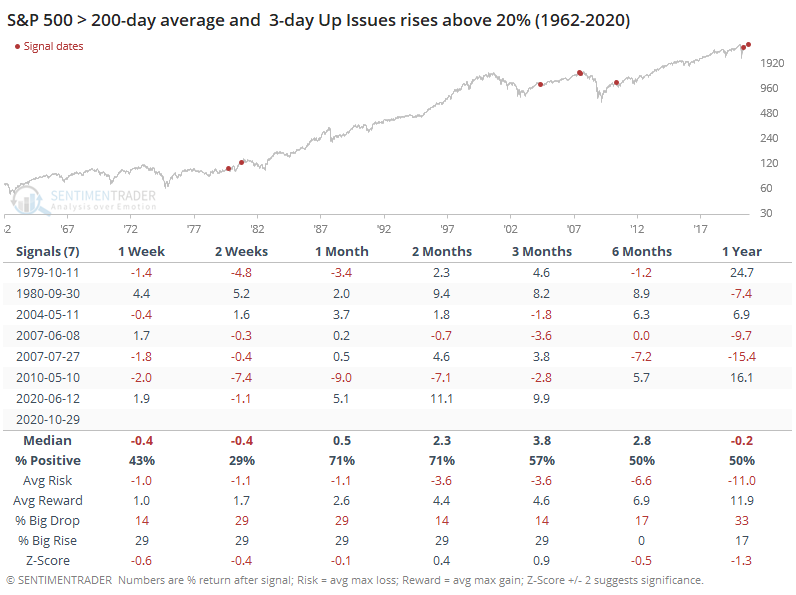
The sample size is small, but for what it's worth, the S&P tended to fall back over the short-term, then rally over the medium-term. There was only one loss of any consequence 2 months later.
If we forget about the 200-day average and just look at times when the S&P at least wasn't more than 20% below its highest level of the past 3 years, then we get more of a sample size.
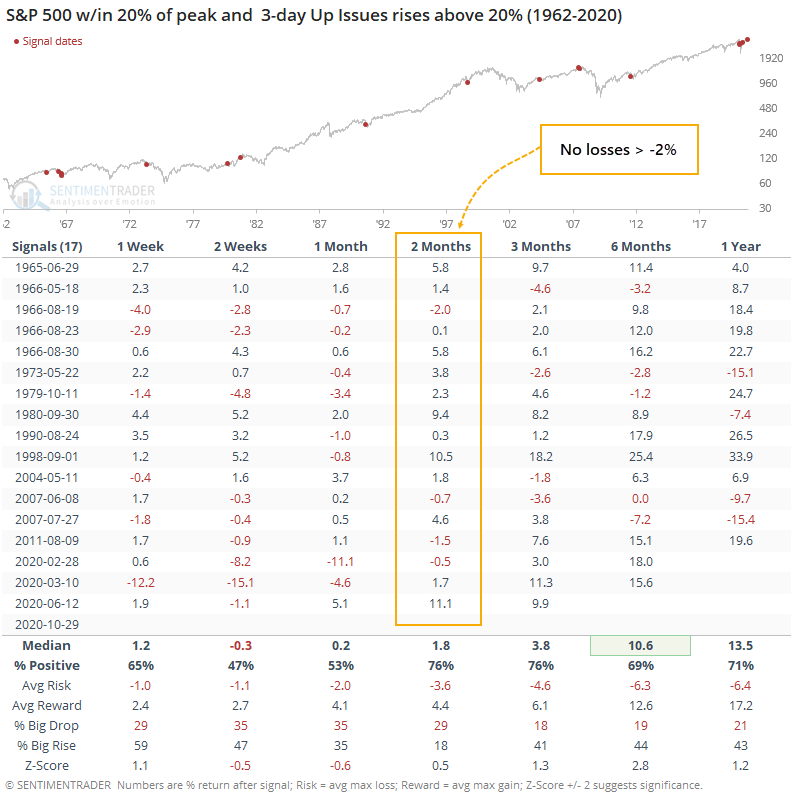
Despite many more signals, the same basic pattern held, with shorter-term weakness and medium-term strength. Over the next 2 months, there were no losses greater than -2%.
It was much more unusual if the S&P was within 10% of its prior peak, as it was this time.
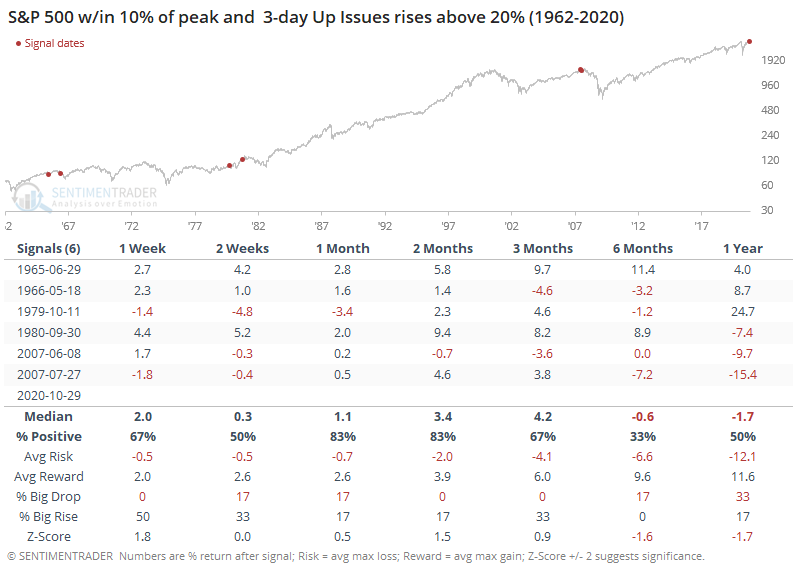
There was only a single loss during the next 1-2 months, with relatively small risk. The troubling part was the 6-12 month time frame, which showed a loss every time but once.
Overall, this kind of behavior has typically led to some shorter-term give-back of whatever gains helped to push the Up Issue and Up Volume Ratios above 20%. But over the next 1-3 months, there was a strong tendency to see gains following the selling pressure that was extreme enough to push them both below 20% in the first place.