Data &
Technology
Research
Reports
Report Solutions
Reports Library
Actionable
Strategies
Free
Resources
Simple Backtest Calculator
Simple Seasonality Calculator
The Kelly Criterion Calculator
Sentiment Geo Map
Public Research Reports
Free Webinar
Pricing
Company
About
Meet Our Team
In the News
Testimonials
Client Success Stories
Contact
Log inLoginSign up
< BACK TO ALL REPORTS

A Shocking Update on Sentiment

Jason Goepfert
2021-08-20
The latest Consumer Sentiment figures from the University of Michigan show abnormally low optimism given a roaring stock market.

Politics is playing havoc with how people are feeling about everyday life, and it's even overriding how they usually feel about topics that aren't necessarily as influenced by our representatives.

The preliminary Consumer Sentiment survey for August by the University of Michigan showed a stunning drop. Not only is the survey relatively low, it was the biggest miss in 20 years relative to economists' expectations. Granted, this could change substantially by the time the official reading is released in a couple of weeks.

This is an abnormally low reading given how the S&P 500 has fared over the past year. There is a positive correlation between the 12-month rate of change in the S&P and the Consumer Sentiment readings, and this month really stands out as an outlier.

Consumer Sentiment versus S&P 500 change

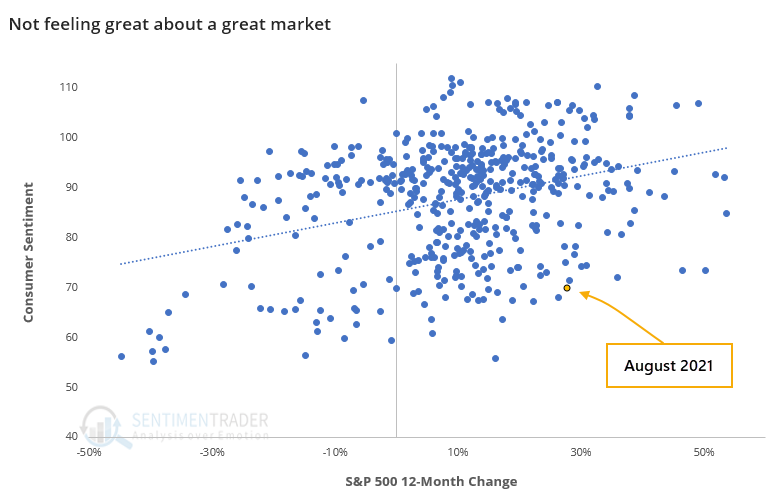
Assuming the S&P doesn't completely fall apart in the coming weeks, this month's reading would be the 2nd-lowest all-time for any month when stocks closed at a 12-month closing high. Only December 1991 would have a lower reading.

A low Consumer Sentiment reading during a month when the S&P closed at a new high tended to be a good sign.


What else we're looking at

  • How the S&P 500 performs after a big miss in Consumer Sentiment
  • What a low Sentiment reading, and a big monthly drop, means when stocks are doing well
  • Breadth among small-cap stocks hasn't had a run like this in over a year
  • A detailed look at an options trade using SPY
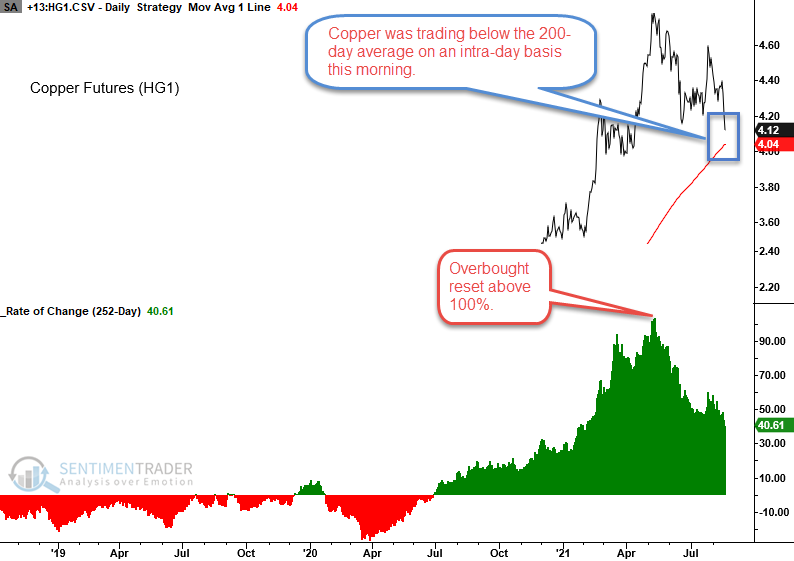
  • What happens after copper does a massive reversal around its 200-day moving average

Stat box

Energy ETFs like XOM and XLE have declined for 6 consecutive days, tying their longest losing streaks since the pandemic crash. The few other 6-day streaks all preceded at least short-term bottoms, so watch for a change in character.

Etcetera

Copper top. Dean shows that copper has dropped below its 200-day moving average, after the metal doubled. Its performance over the next 1-2 months was consistently poor.

copper moving average

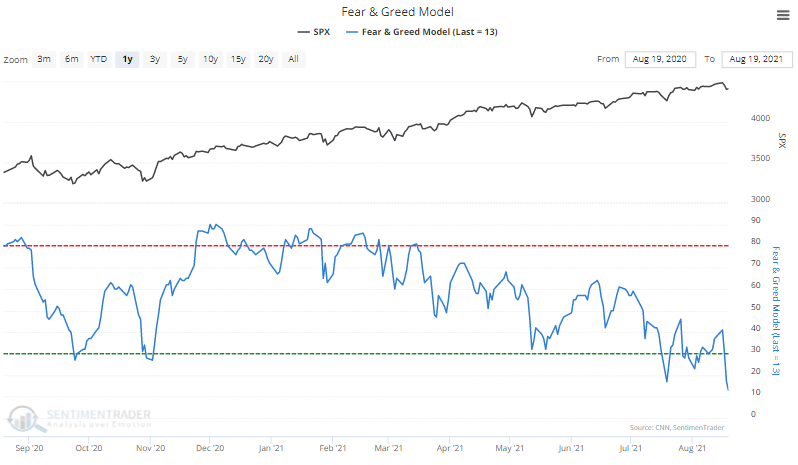
Fear in force. The Fear & Greed model plunged to its lowest level in a year on Thursday. Investors have been increasingly less enthused about stocks as they've rallied in recent months...but be careful about simply interpreting this as a knee-jerk contrarian would. This also happened in 2015.

fear & greed model

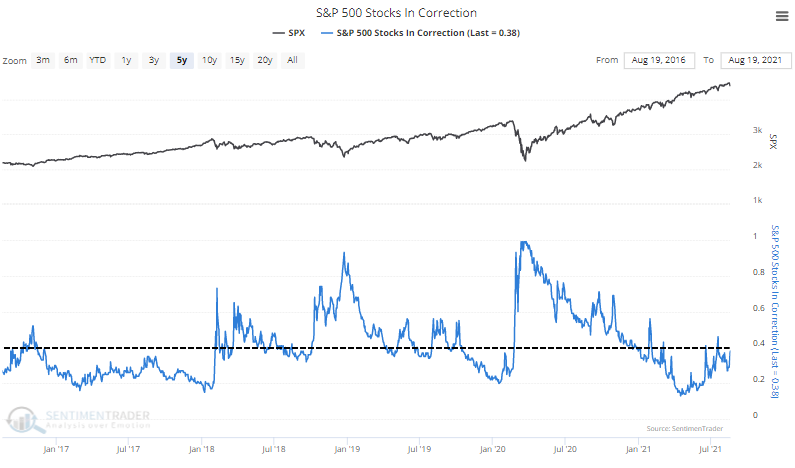
Correction camp. With the latest selloff, nearly 40% of S&P 500 stocks are more than 10% below their peaks. Healthy markets typically see this figure hold consistently below 40%; when above, it signals dangerous internal conditions in the index.

s&p 500 stocks in correction

DATA &
TECHnologies
IndicatorEdge
‍
BackTestEdge
‍
Other Tools
‍
DataEdge API
RESEARCH
reports
Research Solution
‍
Reports Library
‍
actionable
Strategies
Trading Strategies
‍
Smart Stock Scanner
‍
FREE
RESOUrCES
Simple Backtest
Calculator
Simple Seasonality
Calculator
The Kelly Criterion
Calculator
Sentiment Geo Map
‍
Public Research Reports
‍
Free Webinar
COMPANY
‍
About
‍
Meet our Team
‍
In the News
‍
Testimonials
‍
Client Success Stories
Pricing
Bundle pricing
‍
Announcements
‍
FAQ
© 2024 Sundial Capital Research Inc. All rights reserved.
Setsail Marketing
TermsPrivacyAffiliate Program
Risk Disclosure: Futures and forex trading contains substantial risk and is not for every investor. An investor could potentially lose all or more than the initial investment. Risk capital is money that can be lost without jeopardizing ones’ financial security or life style. Only risk capital should be used for trading and only those with sufficient risk capital should consider trading. Past performance is not necessarily indicative of future results.

Hypothetical Performance Disclosure: Hypothetical performance results have many inherent limitations, some of which are described below. No representation is being made that any account will or is likely to achieve profits or losses similar to those shown; in fact, there are frequently sharp differences between hypothetical performance results and the actual results subsequently achieved by any particular trading program. One of the limitations of hypothetical performance results is that they are generally prepared with the benefit of hindsight. In addition, hypothetical trading does not involve financial risk, and no hypothetical trading record can completely account for the impact of financial risk of actual trading. for example, the ability to withstand losses or to adhere to a particular trading program in spite of trading losses are material points which can also adversely affect actual trading results. There are numerous other factors related to the markets in general or to the implementation of any specific trading program which cannot be fully accounted for in the preparation of hypothetical performance results and all which can adversely affect trading results.

Testimonial Disclosure: Testimonials appearing on this website may not be representative of other clients or customers and is not a guarantee of future performance or success.