Data &
Technology
Research
Reports
Report Solutions
Reports Library
Actionable
Strategies
Free
Resources
Simple Backtest Calculator
Simple Seasonality Calculator
The Kelly Criterion Calculator
Sentiment Geo Map
Public Research Reports
Free Webinar
Pricing
Company
About
Meet Our Team
In the News
Testimonials
Client Success Stories
Contact
Log inLoginSign up
< BACK TO ALL REPORTS

A sharp downward shift in commodity trends

Dean Christians
2023-04-26
A breadth composite for commodities declined by more than 30% over five days, triggering a sell signal. After similar alerts, commodities showed a downward bias over the next three months.

Key points:

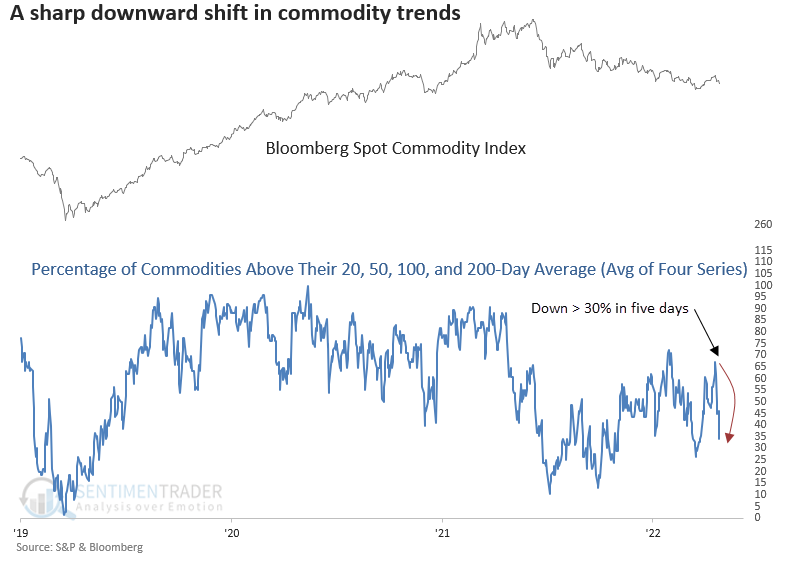
  • A breadth composite for commodities declined by more than 30% in five days
  • Similar downshifts in price trends led to unfavorable returns over the next three months
  • When trends cycle downward near a high, commodity returns are even worse

After a brief bounce, the downtrend in commodities looks set to resume

A composite, which combines the percentage of commodities trading above their 20, 50, 100, and 200-day average, declined by more than 30% over the last five days.

For perspective, the prior downward shift of this magnitude occurred during the Covid crash in January 2020.

With the Dollar Index (DXY) in a downtrend, which tends to be bullish, other factors like slowing economic growth are impacting commodity trends. 

The composite does not include gold and silver. And the signal includes two additional conditions for context similar to the current environment.

Additional Signal Conditions:

  1. The percentage of commodities above their 200-day average < 42%
  2. The average for the composite < 42%

Similar shifts in commodity trends preceded negative returns

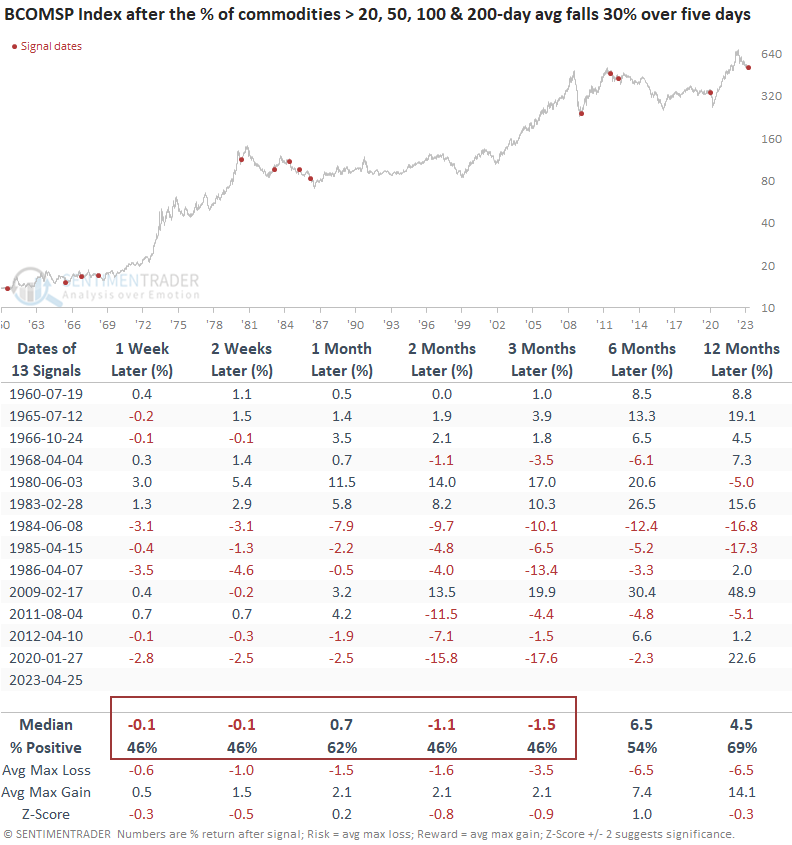
When the commodity composite falls by 30% or more in five days or less, the Bloomberg Spot Commodity Index tends to decline on a consistent basis over the next three months. Recent signals look more alarming 

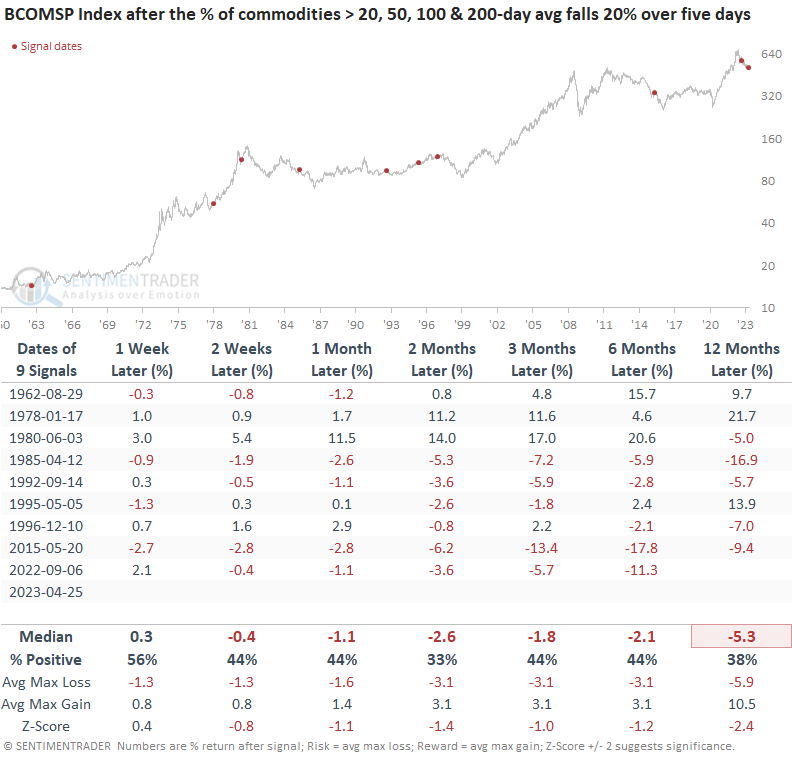
The new signal occurred five days after a 6-week high for the Bloomberg Spot Commodity Index. Let's add that context to the original conditions. However, I must adjust the net change from -30% to -20%. Otherwise, the sample size is only two alerts.

When the composite cycles downward near a high, returns and win rates for the Commodity Index look worse across all time frames. The previous signal occurred right after the significant rally from June to August 2022, which coincided with a broad selloff in risk assets. 

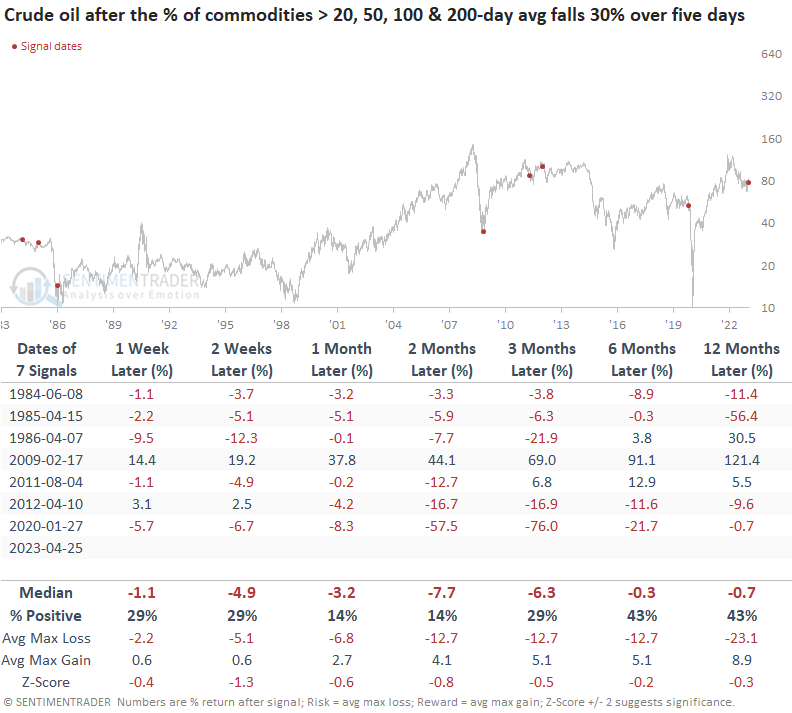
In a previous note, I shared a bullish reversal signal for crude oil. The tactical trade idea suggested oil could initially struggle before moving higher. Now that commodity trends have reversed, that trade looks less compelling.

Due to data limitations, the crude oil outlook table contains fewer signals. 

What excites me about a broad-based allocation to a Commodity Index/ETF?

Investors thinking about an allocation to a broad-based Commodity Index/ETF would be better off waiting for price trends to align in unison. 

The Bloomberg Spot Commodity Index returns are excellent when the composite averages 70% or greater. And a cross above 90% typically indicates a secular uptrend.

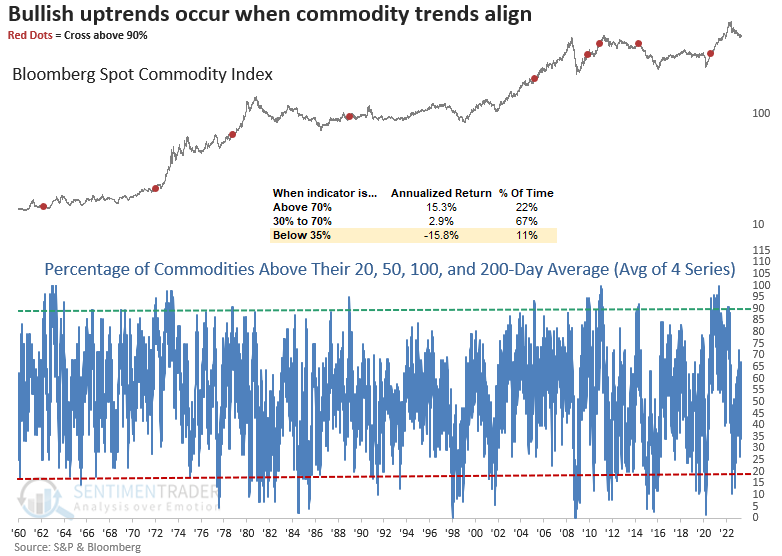
What the research tells us...

A composite, which measures price trends across multiple horizons, declined by more than 30% over a five-day period. After similar downshifts, the Bloomberg Spot Commodity Index struggled over the next three months. The outlook is even more unfavorable when a signal occurs near a high. 

Sorry, you don't have access to this report

Upgrade your subscription plan to get access
Go to Dasboard
DATA &
TECHnologies
IndicatorEdge
‍
BackTestEdge
‍
Other Tools
‍
DataEdge API
RESEARCH
reports
Research Solution
‍
Reports Library
‍
actionable
Strategies
Trading Strategies
‍
Smart Stock Scanner
‍
FREE
RESOUrCES
Simple Backtest
Calculator
Simple Seasonality
Calculator
The Kelly Criterion
Calculator
Sentiment Geo Map
‍
Public Research Reports
‍
Free Webinar
COMPANY
‍
About
‍
Meet our Team
‍
In the News
‍
Testimonials
‍
Client Success Stories
Pricing
Bundle pricing
‍
Announcements
‍
FAQ
© 2024 Sundial Capital Research Inc. All rights reserved.
Setsail Marketing
TermsPrivacyAffiliate Program
Risk Disclosure: Futures and forex trading contains substantial risk and is not for every investor. An investor could potentially lose all or more than the initial investment. Risk capital is money that can be lost without jeopardizing ones’ financial security or life style. Only risk capital should be used for trading and only those with sufficient risk capital should consider trading. Past performance is not necessarily indicative of future results.

Hypothetical Performance Disclosure: Hypothetical performance results have many inherent limitations, some of which are described below. No representation is being made that any account will or is likely to achieve profits or losses similar to those shown; in fact, there are frequently sharp differences between hypothetical performance results and the actual results subsequently achieved by any particular trading program. One of the limitations of hypothetical performance results is that they are generally prepared with the benefit of hindsight. In addition, hypothetical trading does not involve financial risk, and no hypothetical trading record can completely account for the impact of financial risk of actual trading. for example, the ability to withstand losses or to adhere to a particular trading program in spite of trading losses are material points which can also adversely affect actual trading results. There are numerous other factors related to the markets in general or to the implementation of any specific trading program which cannot be fully accounted for in the preparation of hypothetical performance results and all which can adversely affect trading results.

Testimonial Disclosure: Testimonials appearing on this website may not be representative of other clients or customers and is not a guarantee of future performance or success.