Data &
Technology
Research
Reports
Report Solutions
Reports Library
Actionable
Strategies
Free
Resources
Simple Backtest Calculator
Simple Seasonality Calculator
The Kelly Criterion Calculator
Sentiment Geo Map
Public Research Reports
Free Webinar
Pricing
Company
About
Meet Our Team
In the News
Testimonials
Client Success Stories
Contact
Log inLoginSign up
< BACK TO ALL REPORTS

A Sentiment Reversal in SPY

Jason Goepfert
2021-09-27
Last week, the most important ETF in the world enjoyed a big and sudden reversal in sentiment.

Last week, traders become pessimistic about prospects for the world's most important ETF. Then, suddenly, they calmed down.

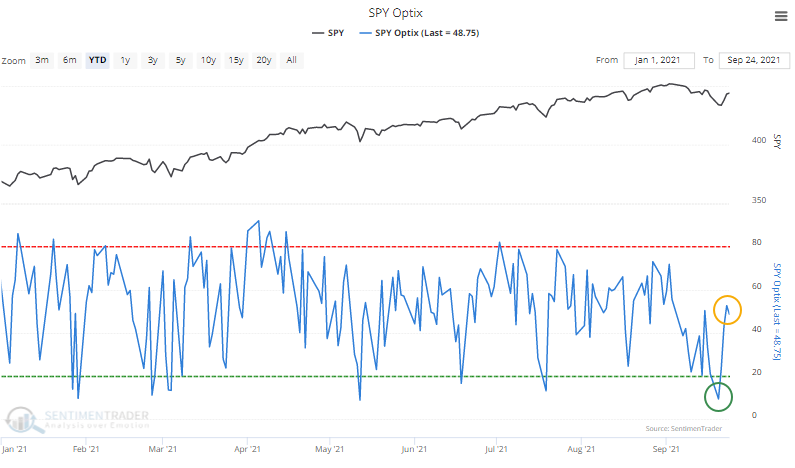
Early in the week, our Optimism Index (Optix) for the S&P 500 ETF fell to a pessimistic level below 10%. The Optix Index then normalized, surging above 50% in only a few sessions.

SPY sentiment

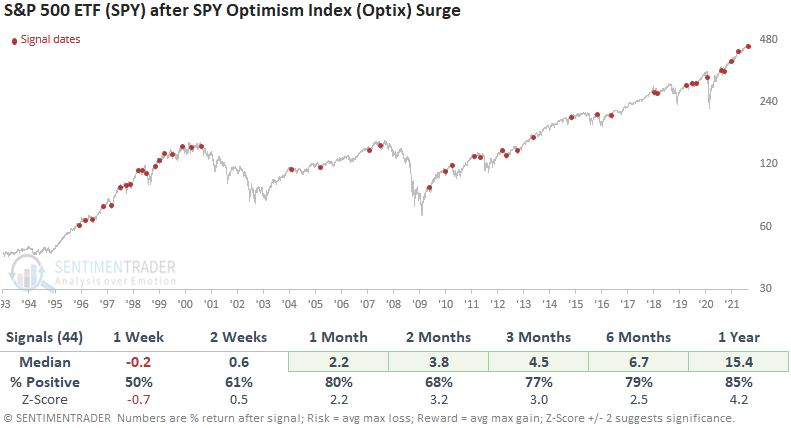
Dean conducted a study to identify the outlook for the S&P 500 ETF when the Optix Index falls below ten and subsequently increases above fifty in three trading sessions or fewer.

The results look good on an intermediate to long-term basis with several notable z-scores. As is the case with most mean reversion signals, the short-term performance can reflect choppy conditions associated with a bottoming process. And bear markets are unkind to short-term reversals. 

Now, let's add a trend filter to find signals similar to last week. We'll include a condition that requires the SPY ETF to be trading above its respective 200-day moving average at the time of the sentiment reversal.

spy sentiment reversal

Except for the first two weeks, the results look excellent, with several notable z-scores. Context is always important.


What else we're looking at

  • Full returns in SPY after short-term sentiment reversals
  • A look at forward returns in China tech stock Tencent after a surge in corporate share buybacks

Stat box

According to Lipper, last week, investors pulled $6.7 billion from equity funds. That ended several weeks of inflows and was the largest single-week outflow since mid-July. It was the 4th-largest outflow of the year.

Etcetera

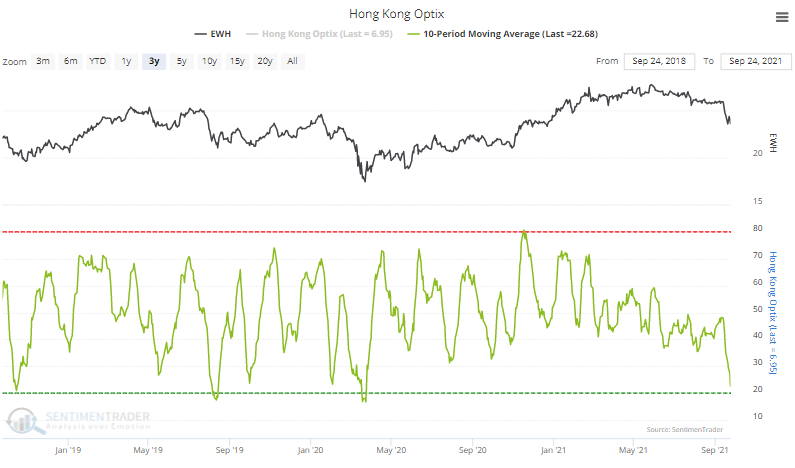
Hong Kong correction. A 10-day average of the Optimism Index for the Hang Seng has dropped to its lowest level since the pandemic crash. It's nearing one of the lowest levels of the past 3 years.

hong kong hang seng sentiment

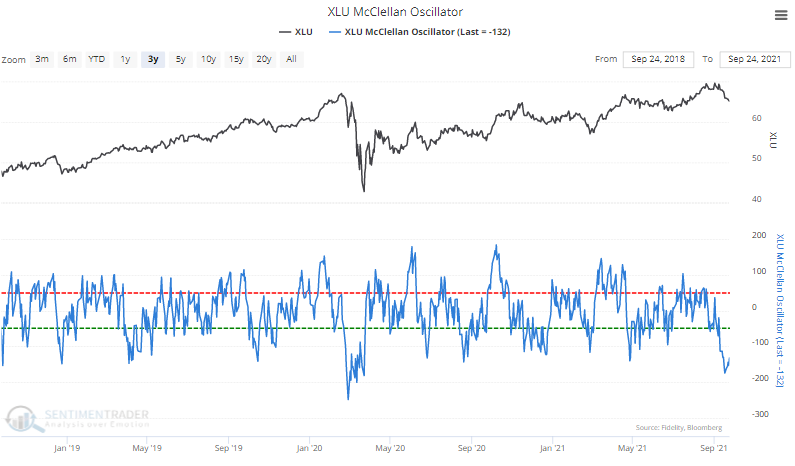
Lights out. The McClellan Oscillator, a sign of internal breadth momentum, has plunged for utility stocks. It's trying to recover from a reading below -150, the 2nd-lowest reading in the past 3 years.

xlu utilities mcclellan oscillator

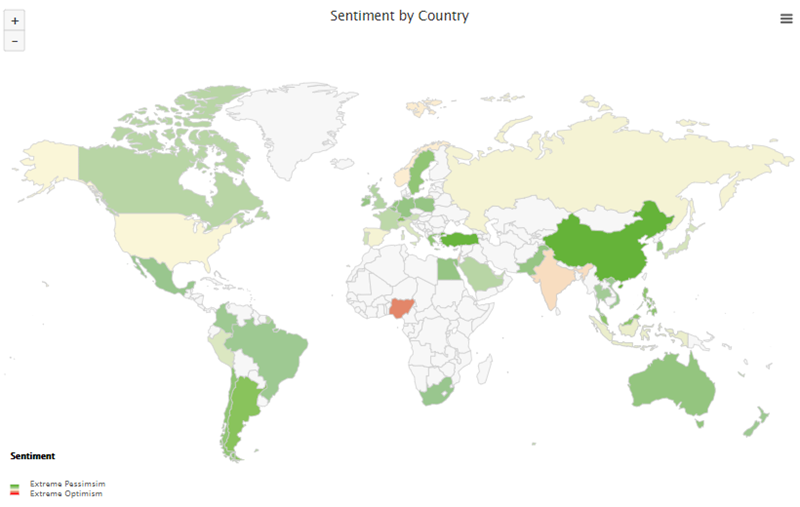
Is anyone optimistic? Our Optimism Index Geo-Map shows that pessimism is prevalent around the world. The only place with a hint of optimistic investors? Nigeria.

sentiment around the world

DATA &
TECHnologies
IndicatorEdge
‍
BackTestEdge
‍
Other Tools
‍
DataEdge API
RESEARCH
reports
Research Solution
‍
Reports Library
‍
actionable
Strategies
Trading Strategies
‍
Smart Stock Scanner
‍
FREE
RESOUrCES
Simple Backtest
Calculator
Simple Seasonality
Calculator
The Kelly Criterion
Calculator
Sentiment Geo Map
‍
Public Research Reports
‍
Free Webinar
COMPANY
‍
About
‍
Meet our Team
‍
In the News
‍
Testimonials
‍
Client Success Stories
Pricing
Bundle pricing
‍
Announcements
‍
FAQ
© 2024 Sundial Capital Research Inc. All rights reserved.
Setsail Marketing
TermsPrivacyAffiliate Program
Risk Disclosure: Futures and forex trading contains substantial risk and is not for every investor. An investor could potentially lose all or more than the initial investment. Risk capital is money that can be lost without jeopardizing ones’ financial security or life style. Only risk capital should be used for trading and only those with sufficient risk capital should consider trading. Past performance is not necessarily indicative of future results.

Hypothetical Performance Disclosure: Hypothetical performance results have many inherent limitations, some of which are described below. No representation is being made that any account will or is likely to achieve profits or losses similar to those shown; in fact, there are frequently sharp differences between hypothetical performance results and the actual results subsequently achieved by any particular trading program. One of the limitations of hypothetical performance results is that they are generally prepared with the benefit of hindsight. In addition, hypothetical trading does not involve financial risk, and no hypothetical trading record can completely account for the impact of financial risk of actual trading. for example, the ability to withstand losses or to adhere to a particular trading program in spite of trading losses are material points which can also adversely affect actual trading results. There are numerous other factors related to the markets in general or to the implementation of any specific trading program which cannot be fully accounted for in the preparation of hypothetical performance results and all which can adversely affect trading results.

Testimonial Disclosure: Testimonials appearing on this website may not be representative of other clients or customers and is not a guarantee of future performance or success.