
A seasonal strategy for long-term treasuries

Key points
- For reasons that are not readily apparent, long-term treasury bond price movements tend to be highly cyclical, both on an annual and a monthly basis
- Our annual seasonal trend chart highlights two distinct favorable and two distinct unfavorable periods
- The end of the month has shown a tendency to be favorable for long-term treasury bonds
- In this piece, we combine the two seasonal trends above into the JK TLT Seasonal Model
The annual seasonal trend
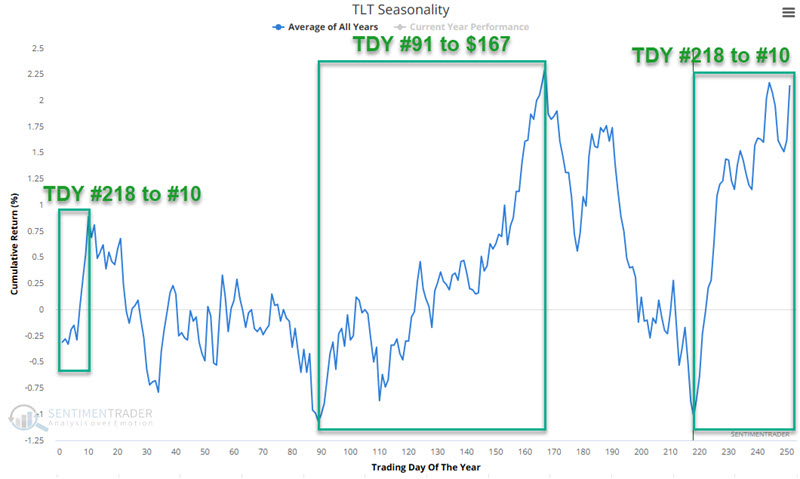
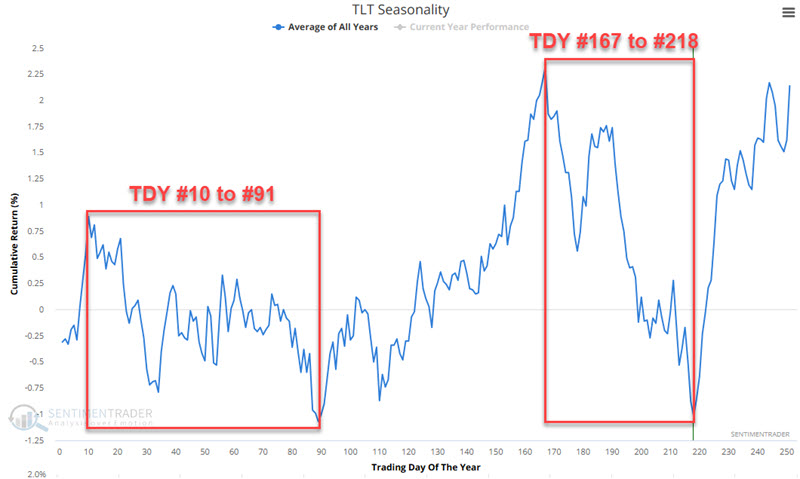
The chart below displays the annual seasonal trend for the iShares 20+ Year Treasury ETF (ticker TLT). We note four distinct periods, using Trading Day of the Year (TDY):
- TDY #10 through TDY #91 = Unfavorable
- TDY #91 through TDY #167 = Favorable
- TDY #167 through TDY #218 = Unfavorable
- TDY #218 through TDY #10 (the following year) = Favorable
All charts below use total return data for ticker TLT. At the end, I will include a table that compares results using total return data versus price-only data.
Unfavorable seasonal periods
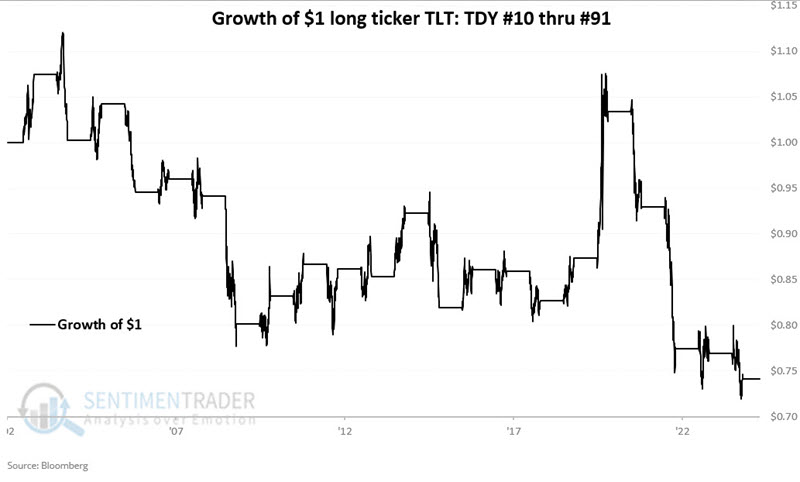
The chart below displays the hypothetical growth of $1 invested in ticker TLT only from TDY #10 through TDY #91 starting in 2002. $1 declined 26% to $0.74.
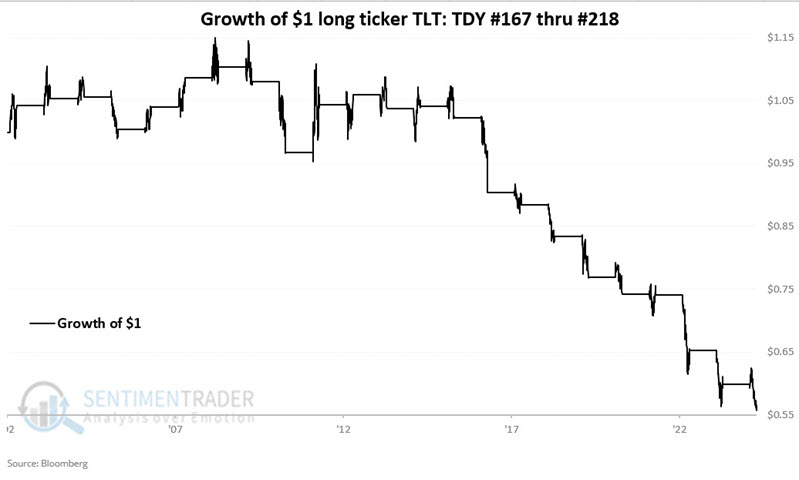
The chart below displays the hypothetical growth of $1 invested in ticker TLT only from TDY #167 through TDY #218 starting in 2002. $1 declined 43% to $0.57.
The chart below combines the two above and displays the hypothetical growth of $1 invested in TLT only during the two unfavorable seasonal periods highlighted above. $1 declined 58% to $0.42.
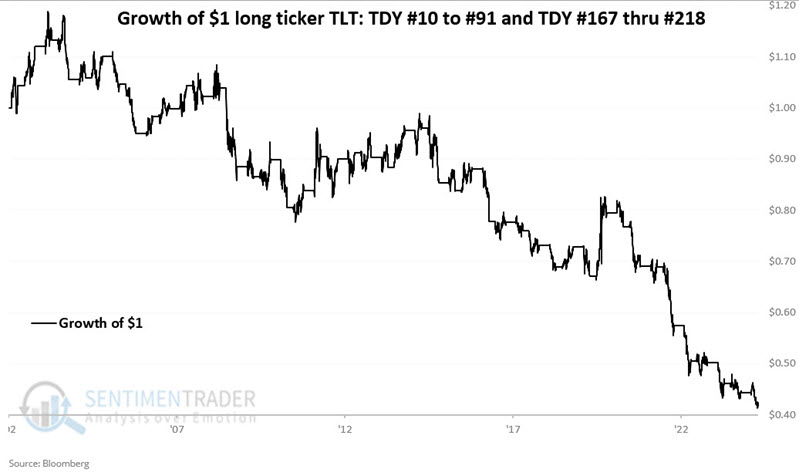
Results can obviously vary widely on a period-by-period basis. But for a trader looking for an "edge," there appears to be value in generally avoiding a long position in TLT-or possibly playing the short side-during these unfavorable seasonal periods.
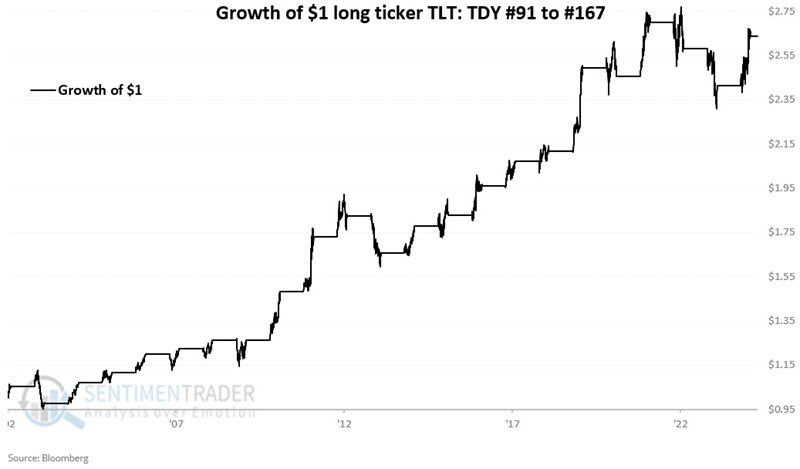
Favorable seasonal periods
The chart below displays the hypothetical growth of $1 invested in ticker TLT only from TDY #91 through TDY #167 starting in 2002. $1 increased 164% to $2.64.
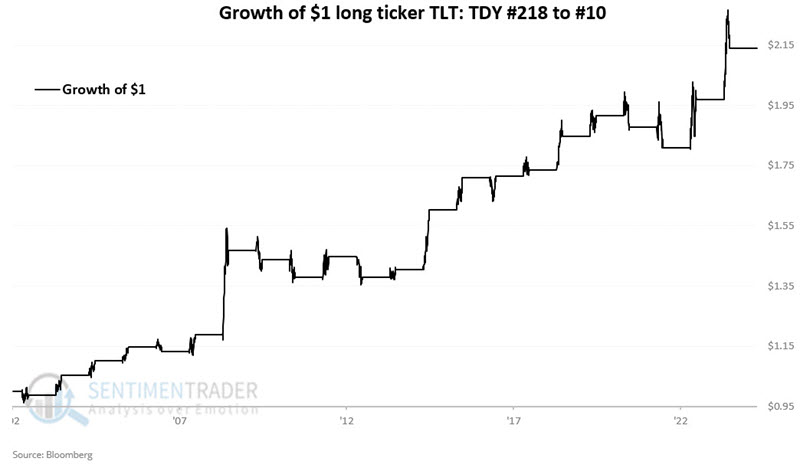
The chart below displays the hypothetical growth of $1 invested in ticker TLT only from TDY #218 through TDY #10 of the following year, starting in 2002. $1 increased 114% to $2.14. This period begins at the close on 2024-11-11 and extends through the close on 2025-01-15.
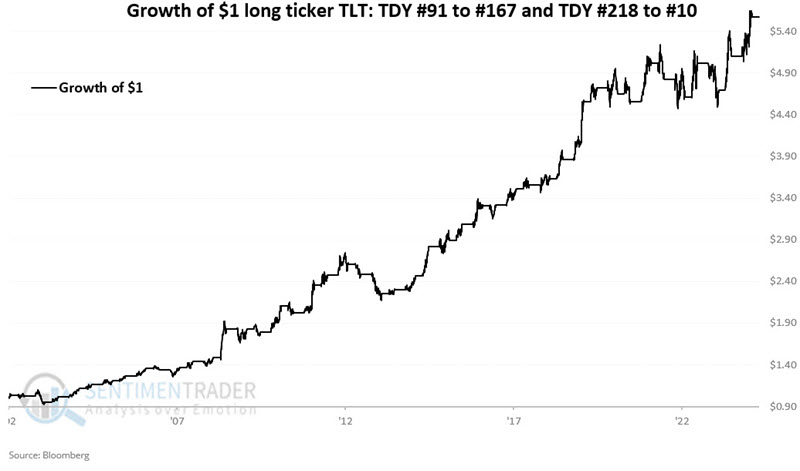
The chart below combines the two above and displays the hypothetical growth of $1 invested in TLT only during the two favorable seasonal periods highlighted above. $1 increased 465% to $5.64
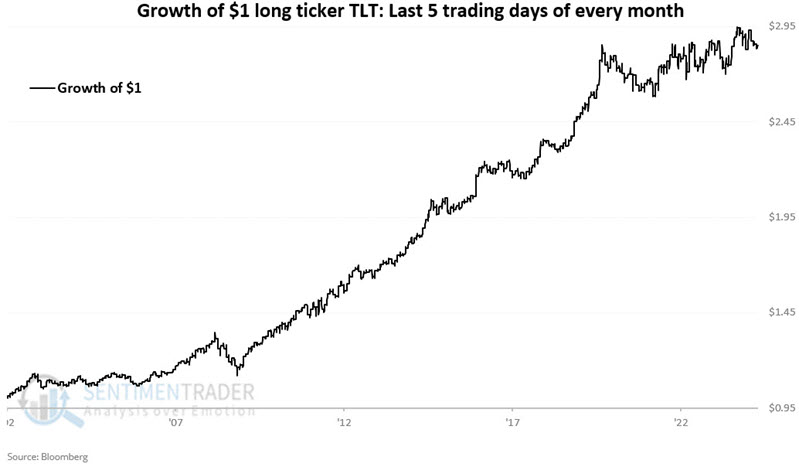
The last five trading days of the month
The chart below displays the hypothetical growth of $1 invested in TLT only during the last five trading days of each month since 2002. $1 increased 185% to $2.85.
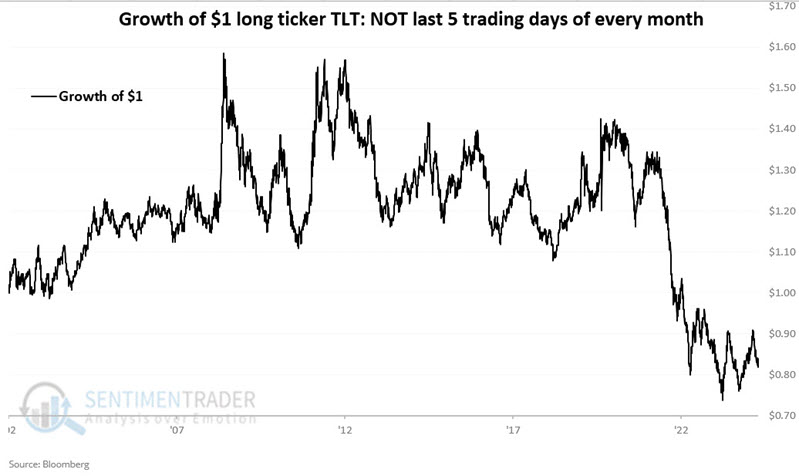
For comparison, the chart below displays the hypothetical growth of $1 invested in TLT only during all other days of the month (i.e., all days EXCEPT the last five trading days of the month) since 2002. $1 declined 17% to $0.83.
Combining Annual Trend with Monthly Trend to create the JK TLT Seasonal Model
Let's set the following rules:
A = If TDY is between #91 and #167 OR between #218 to #10 then A = +2 else A = 0
B = If today is within the last five trading days of the month, the B = +1 else B = 0
JK TLT Seasonal Model (JTSM) = A + B
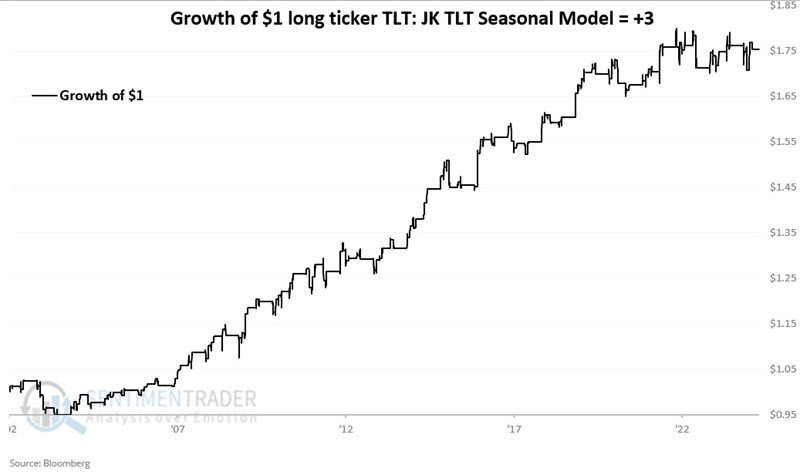
The chart below displays the hypothetical growth of $1 invested in TLT only if the JTSM = +3. $1 increased 75% to $1.75.
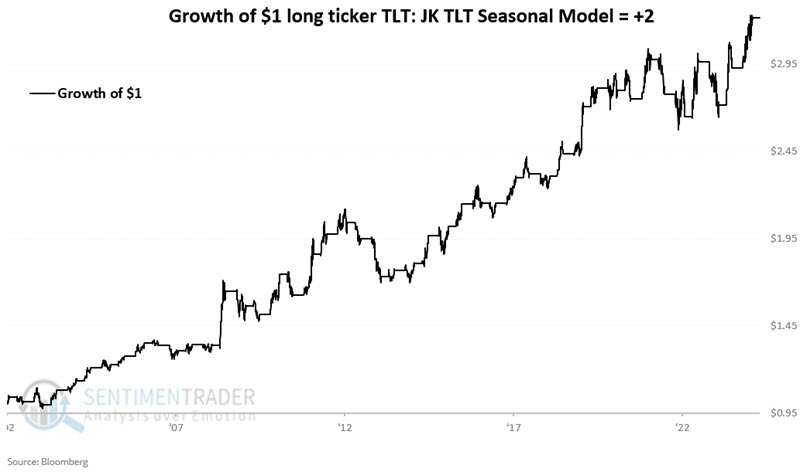
The chart below displays the hypothetical growth of $1 invested in TLT only if the JTSM = +2. $1 increased 222% to $3.22.
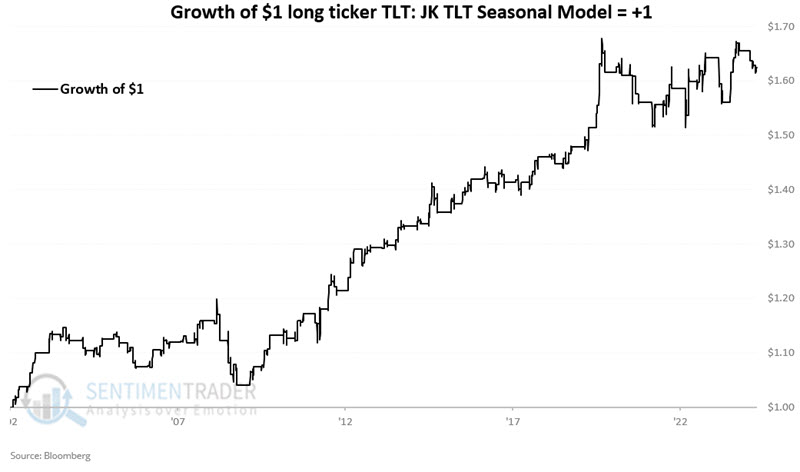
The chart below displays the hypothetical growth of $1 invested in TLT only if the JTSM = +1. $1 increased 62% to $1.62.
While all the equity curve charts above have their ups and downs, overall, they each trend lower-left-to-upper-right. Now, let's combine any positive reading for the JTSM into one equity curve chart.
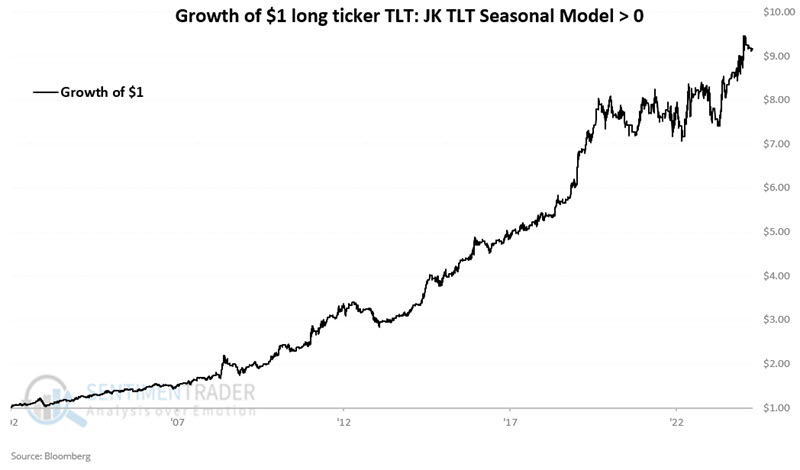
The chart below displays the hypothetical growth of $1 invested in TLT only if the JTSM > 0. $1 increased 817% to $9.17.
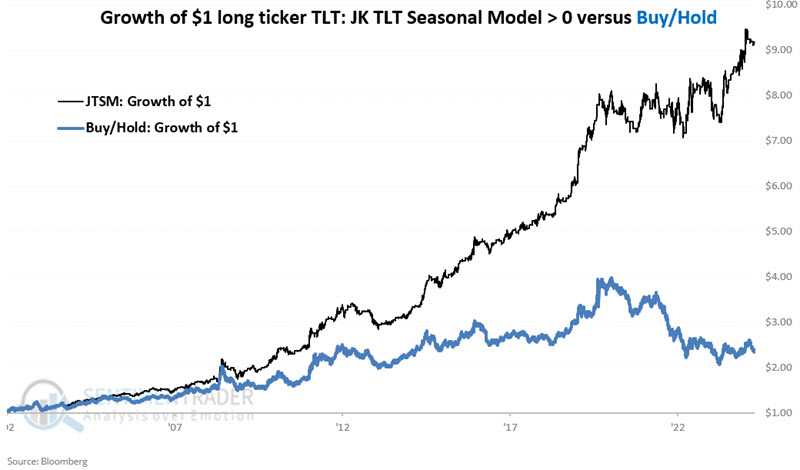
For perspective, the chart below shows the line above and the equity curve for buying and holding TLT from 2002 to 2024.
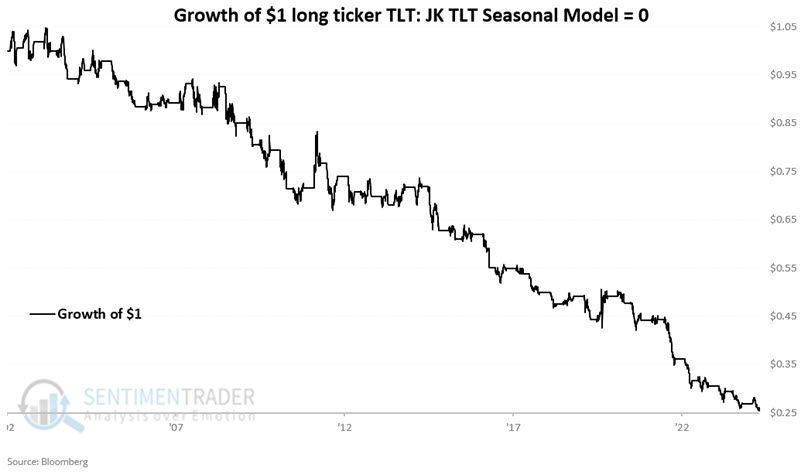
The chart below displays the hypothetical growth of $1 invested in TLT only if TLT Model = 0. $1 declined -74% to $0.26.
Summarizing results
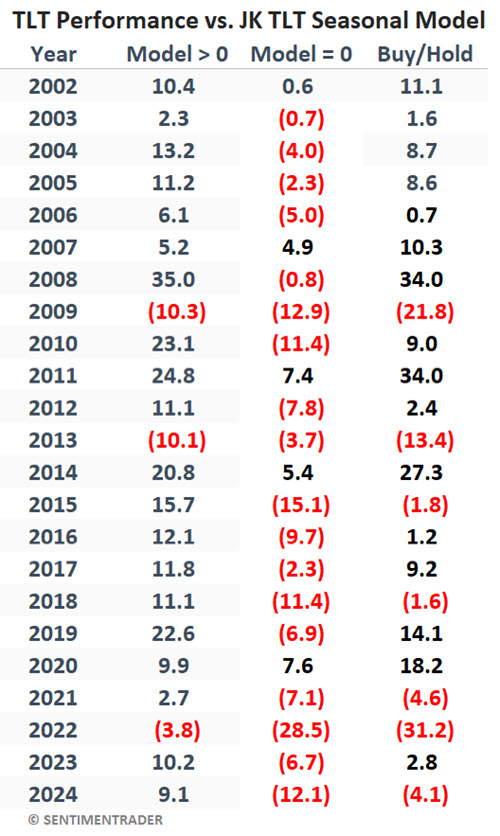
The table below displays the hypothetical annual results for the JK TLT Seasonal Model, depending on whether the model was > 0 or equal to 0, compared to buying and holding TLT (again, these results use total return data).
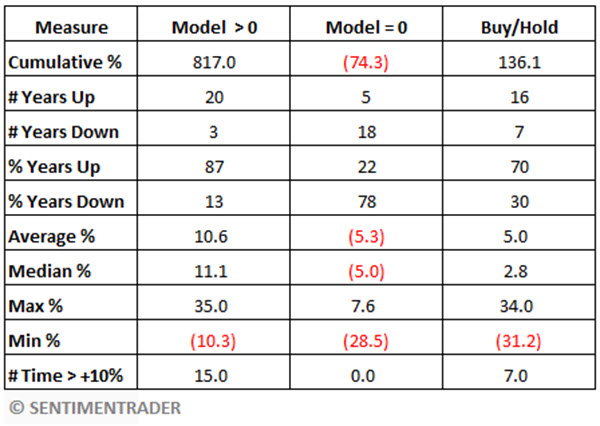
The table below summarizes the performance for:
- Model readings above 0
- Model readings equal to 0
- Buy-and-Hold
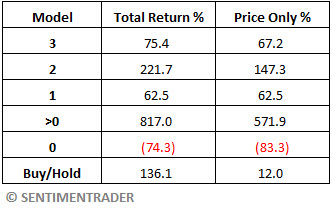
The results above were generated using "Total Return" data, which factors in dividends paid. To cover all the bases, the table below displays those results versus results generated using price only (i.e., no dividends included).
Upcoming Periods of TLT Model = 0
The JK TLT Seasonal Model will be above 0 starting on 2024-11-12 through the close on 2025-01-15.
The following periods will show a TLT Model reading of 0. The period begins at the close of the first day listed and ends at the close of the last day listed. The JTSM will consider these periods to be "unfavorable." All other periods will be regarded as "favorable."
- 2025-01-15 to 2025-01-24
- 2025-01-31 to 2025-02-21
- 2025-02-28 to 2025-03-24
- 2025-03-31 to 2025-04-23
- 2025-04-30 to 2025-05-13
- 2025-09-02 to 2025-09-23
- 2025-09-30 to 2025-10-24
- 2025-10-31 to 2025-11-12
What the research tells us…
Is it possible to "beat the bond market" with nothing but a calendar? Ah, there's the rub. Over the past 20 years, the answer appears to be at least "apparently so." However, we must again caution that there are never any guarantees that any seasonal trend will persist ad infinitum into the future. So if the question is, "Will TLT perform better going forward when the JTSM is > 0?" the honest answer is "Maybe." It is typically best to pair any seasonal model with price action confirmation. When seasonals and price action (however each trader defines it) are simultaneously favorable - or unfavorable - there is often a decent trading opportunity.