Data &
Technology
Research
Reports
Report Solutions
Reports Library
Actionable
Strategies
Free
Resources
Simple Backtest Calculator
Simple Seasonality Calculator
The Kelly Criterion Calculator
Sentiment Geo Map
Public Research Reports
Free Webinar
Pricing
Company
About
Meet Our Team
In the News
Testimonials
Client Success Stories
Contact
Log inLoginSign up
< BACK TO ALL REPORTS

A reversal in sentiment suggests higher stock prices

Dean Christians
2022-01-03
The Intermediate-Term Optimism Index reversed from a pessimistic level relative to its 2-month range, triggering a buy signal for the S&P 500.

Key points:

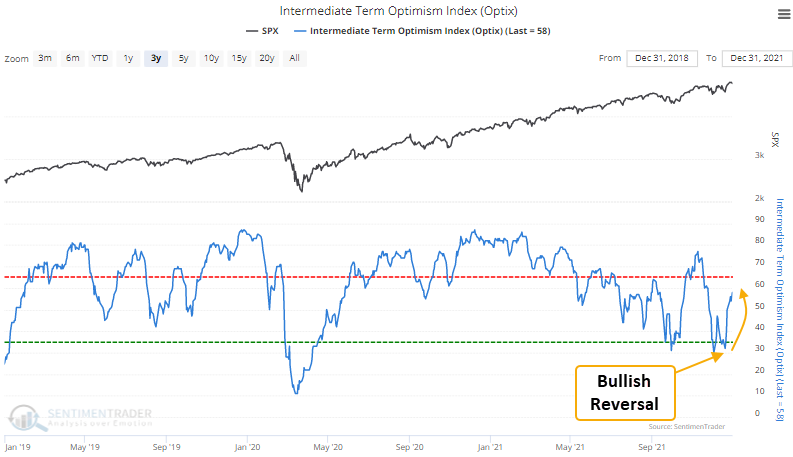
  • The intermediate-term optimism index reversed higher relative to its recent range
  • The S&P 500 ETF (SPY) shows a strong tendency to rally after similar patterns

Using the optimism index as a way to measure sentiment regime changes 

A trading model that uses the Intermediate Term Optimism Index (Optix) to identify when sentiment reverses from a period of pessimism issued a buy signal last week. 

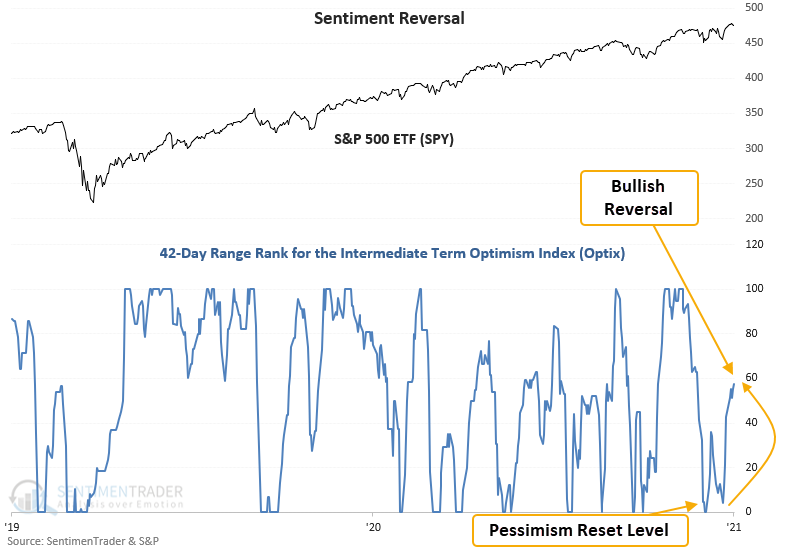
The model applies a 42-day range rank to Intermediate Term Optimism Index. As a reminder, the range rank indicator measures the current value relative to all other values over a lookback period. 100 is the highest, and 0 is the lowest. The pessimistic reset condition is confirmed when the range rank for the Optix Index crosses below the 5th percentile. A new buy signal occurs when the range rank crosses back above the 55th percentile. At the same time, the 5-day rate of change for the SPY ETF must be >= 1.5%. i.e., market momentum is positive.

Sentiment signals work best when they reverse from an extreme

SPY shows a significant z-score in 6 out of 7 periods 

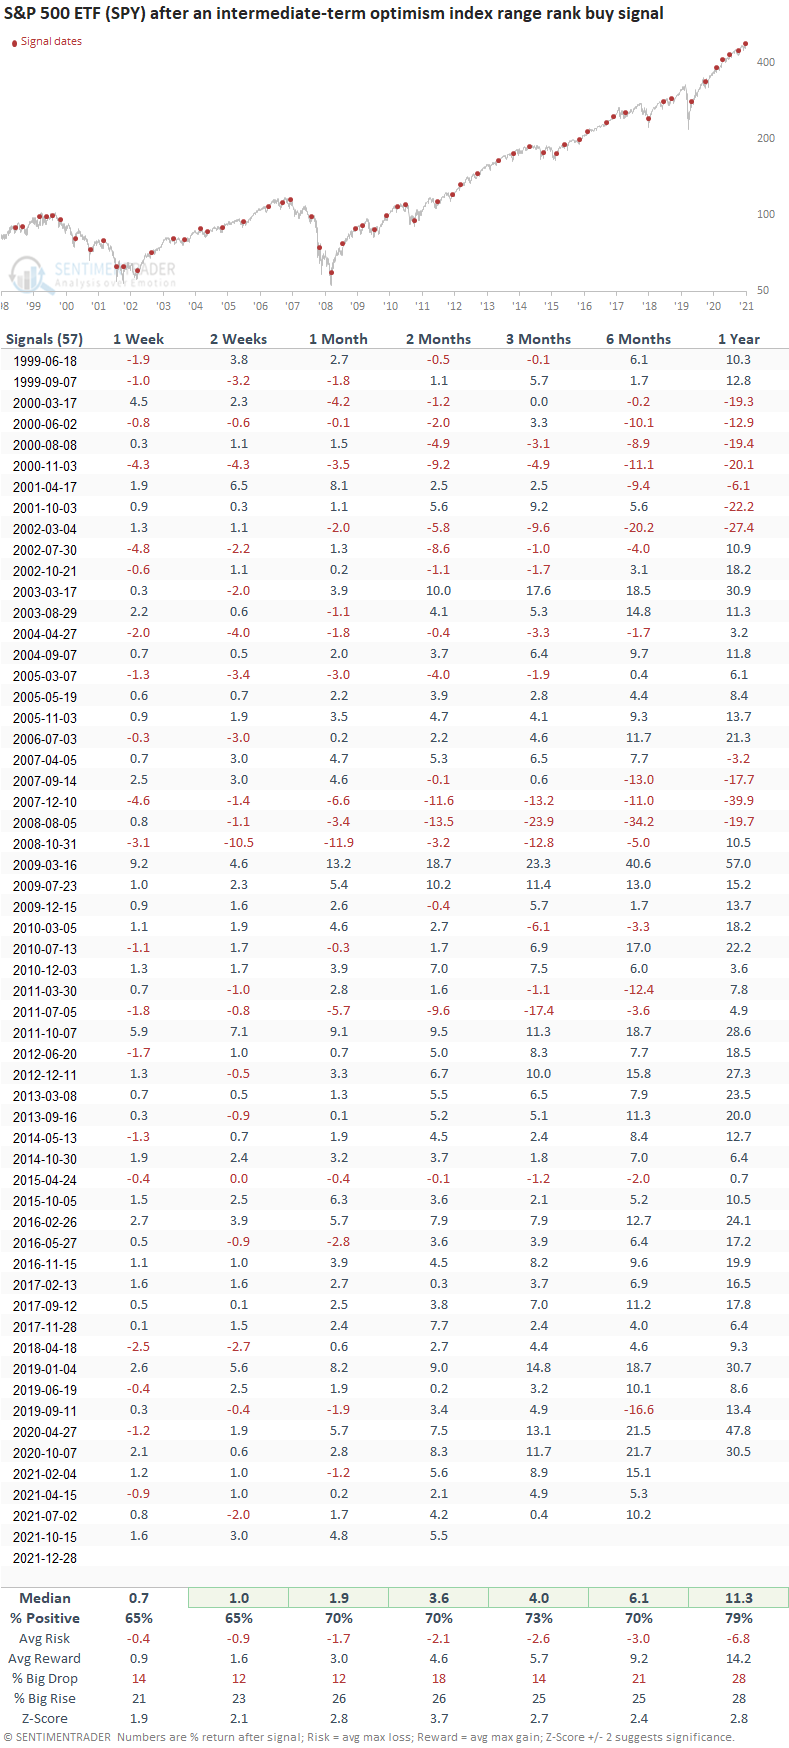
This signal has triggered 57 other times over the past 23 years. After the others, SPY's future returns, win rates, and risk/reward profiles were solid across all time frames. Since the 2009 low, the win rate in the 2-month time frame has been excellent, with 30 out of 33 winners. Negative 1-year results are associated with bear market periods.

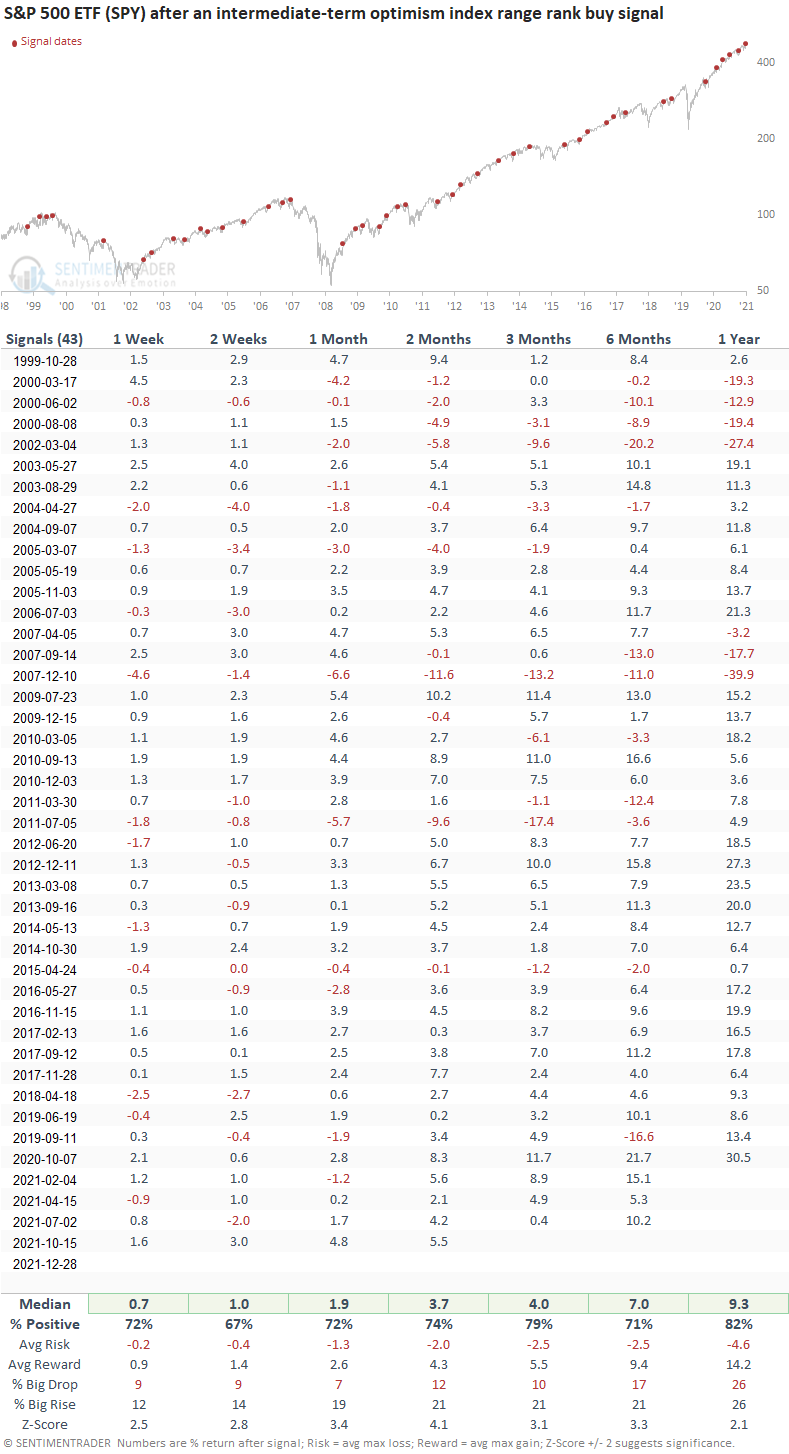
Signals when the SPY ETF is trading above its 200-day moving average

This signal has triggered 43 other times over the past 23 years. After the others, SPY's future returns, win rates, and risk/reward profiles were solid across all time frames. If we compare the two signals, the 3-month time frame shows a nice increase in the win rate. Once again, negative 1-year results are associated with bear market periods.

What the research tells us...

When the Intermediate-Term Optimism Index reverses from a pessimist level relative to its 2-month range, it signals that traders have become more optimistic about the future direction of stocks. Using the Optix index to measure that change in sentiment, similar setups to what we're seeing now have preceded rising SPY prices across every time frame.

Sorry, you don't have access to this report

Upgrade your subscription plan to get access
Go to Dasboard
DATA &
TECHnologies
IndicatorEdge
‍
BackTestEdge
‍
Other Tools
‍
DataEdge API
RESEARCH
reports
Research Solution
‍
Reports Library
‍
actionable
Strategies
Trading Strategies
‍
Smart Stock Scanner
‍
FREE
RESOUrCES
Simple Backtest
Calculator
Simple Seasonality
Calculator
The Kelly Criterion
Calculator
Sentiment Geo Map
‍
Public Research Reports
‍
Free Webinar
COMPANY
‍
About
‍
Meet our Team
‍
In the News
‍
Testimonials
‍
Client Success Stories
Pricing
Bundle pricing
‍
Announcements
‍
FAQ
© 2024 Sundial Capital Research Inc. All rights reserved.
Setsail Marketing
TermsPrivacyAffiliate Program
Risk Disclosure: Futures and forex trading contains substantial risk and is not for every investor. An investor could potentially lose all or more than the initial investment. Risk capital is money that can be lost without jeopardizing ones’ financial security or life style. Only risk capital should be used for trading and only those with sufficient risk capital should consider trading. Past performance is not necessarily indicative of future results.

Hypothetical Performance Disclosure: Hypothetical performance results have many inherent limitations, some of which are described below. No representation is being made that any account will or is likely to achieve profits or losses similar to those shown; in fact, there are frequently sharp differences between hypothetical performance results and the actual results subsequently achieved by any particular trading program. One of the limitations of hypothetical performance results is that they are generally prepared with the benefit of hindsight. In addition, hypothetical trading does not involve financial risk, and no hypothetical trading record can completely account for the impact of financial risk of actual trading. for example, the ability to withstand losses or to adhere to a particular trading program in spite of trading losses are material points which can also adversely affect actual trading results. There are numerous other factors related to the markets in general or to the implementation of any specific trading program which cannot be fully accounted for in the preparation of hypothetical performance results and all which can adversely affect trading results.

Testimonial Disclosure: Testimonials appearing on this website may not be representative of other clients or customers and is not a guarantee of future performance or success.