A reversal from risk-off to risk-on
Key points:
- The Sentimentrader Risk-On/Off Indicator cycled from a bearish to a bullish condition
- After similar reversals, the S&P 500 ETF showed a consistent upward bias across all time frames
- When the composite shifts upward in five or fewer days, results look even more bullish
The weight of the evidence shifts from risk-off to risk-on
I'm a big fan of composite models, especially when they include a broad range of components.
The Sentimentrader Risk-On/Off Indicator checks all the boxes you want in a composite by incorporating 21 diverse sentiment and breadth-based measures.
A trading model that uses the Sentimentrader Risk-On/Off Indicator cycled from the bottom of its recent range toward the upper end, triggering a risk-on signal for stocks.
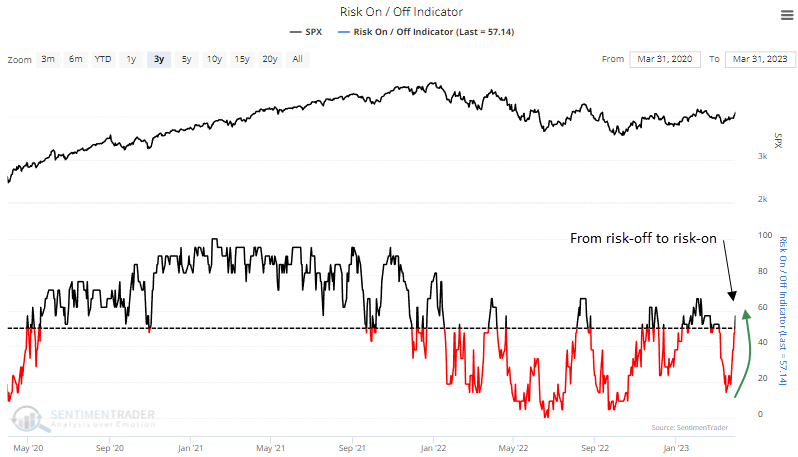
A diverse set of sentiment and breadth measures
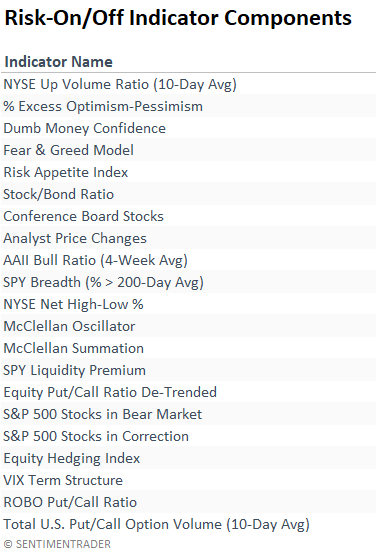
How the trading model works
I apply an 84-day range rank to the Sentimentrader Risk-On/Off indicator. After the range falls below a reset level and subsequently increases above a buy level, the system generates a signal.
The additional overlay to the original indicator smoothes out day-to-day gyrations in the composite, which produces fewer and more meaningful trades.
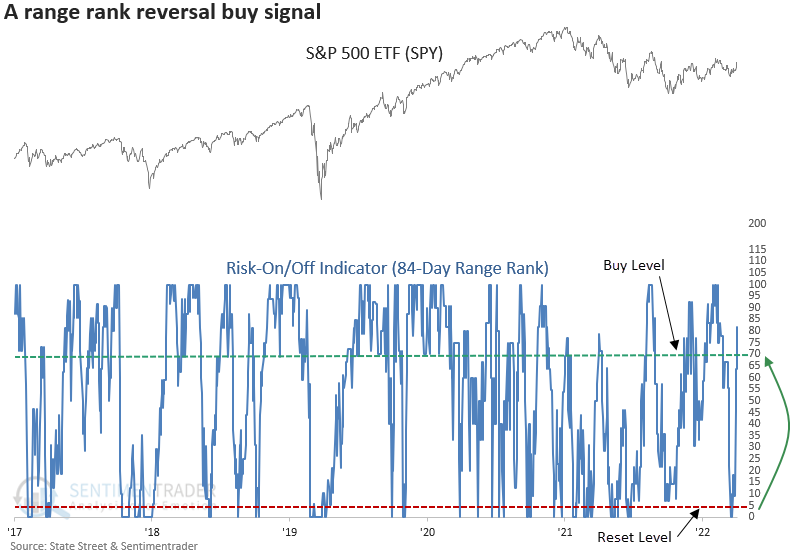
The range rank indicator measures the current value relative to all other values over a lookback period. 100 is the highest, and 0 is the lowest.
Similar reversals preceded positive returns for the S&P 500
When the range rank for the Sentimentrader Risk-On/Off Indicator cycles from < 5% to > 68.5%, the S&P 500 ETF (SPY) tends to rally consistently over time.
While most of the 51 total signals were generated in a bull market environment, the bear market alerts performed well over the next month in prior down cycles.
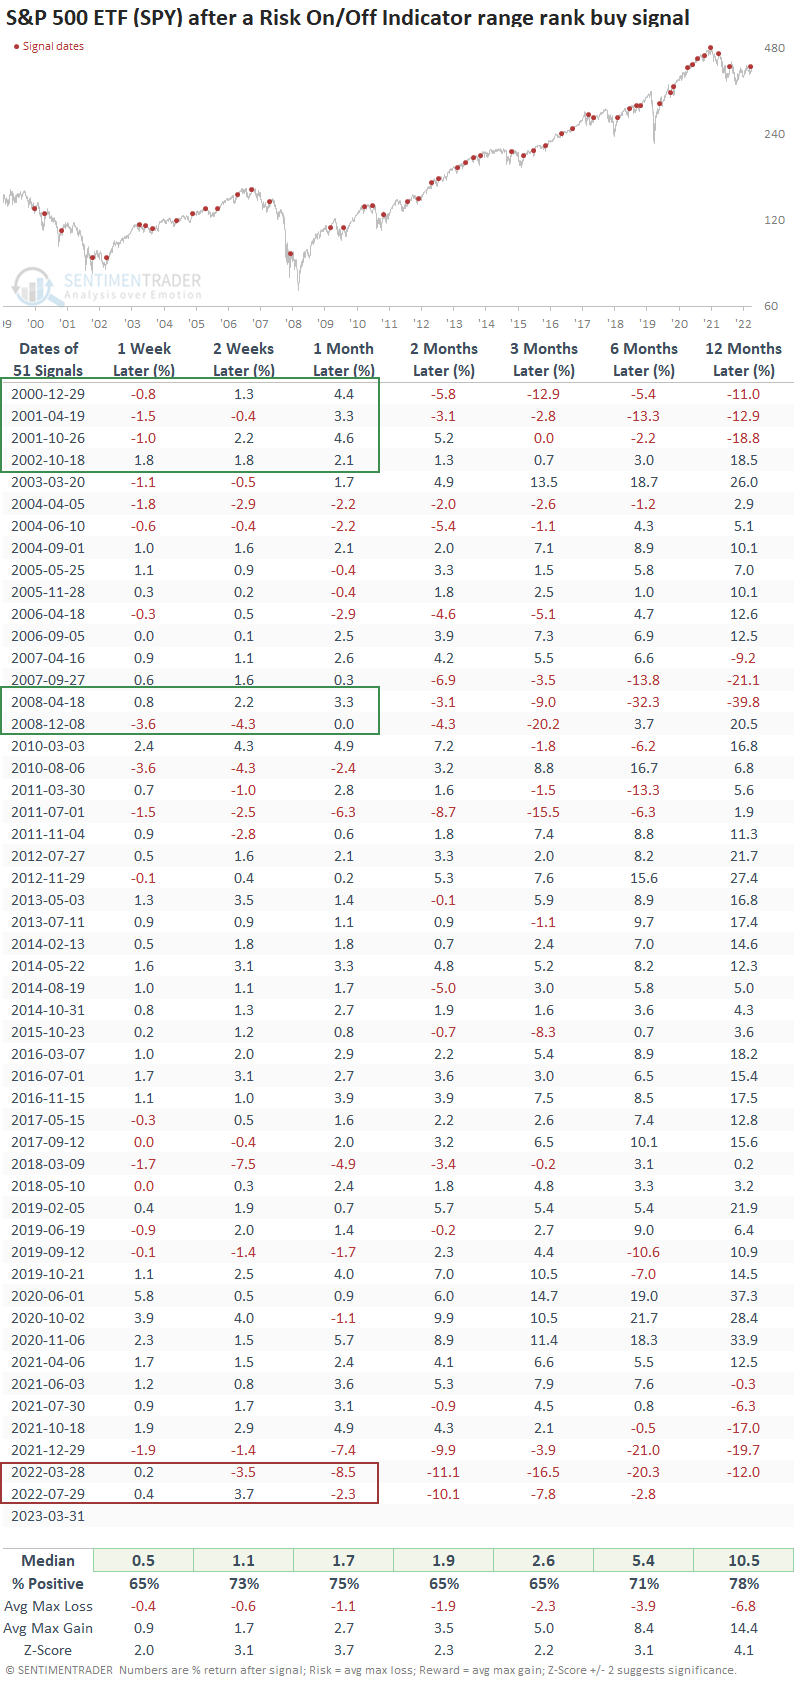
A swift reversal from risk-off to risk-on
When indicators reverse swiftly, a concept that Marty Zweig incorporated into the Zweig Breadth Thrust system, trading signal performance trends are typically more bullish.
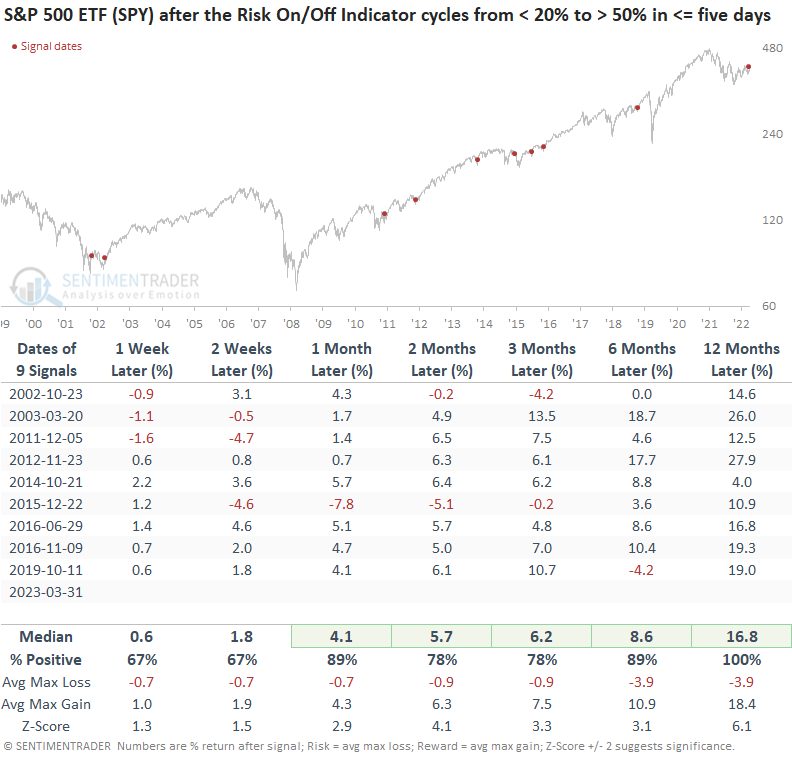
The Sentimentrader Risk-On/Off Indicator cycled from < 20% to > 50% in only five trading days. After similar signals, the S&P 500 was higher 100% of the time a year later. However, we must remember that a few precedents, like October 2002 and December 2015, experienced 10% drawdowns as equity indexes formed bottoms.
What the research tells us...
The Sentimentrader Risk-On/Off Indicator, a diverse composite of sentiment and breadth-based measures, reversed from a bearish to a bullish condition, triggering a risk-on signal for stocks. After similar shifts, the S&P 500 showed a solid tendency to rally across all time horizons. When the composite reversed rapidly, historical precedents looked even more bullish.
While most breadth and sentiment measures lean bullish and long-term indicators look more constructive as each day passes, the market remains in a trading range until further notice. Rangebound markets are notorious for producing whipsaw signals. So, buy pullbacks and don't chase rallies.

