Products
SentimenTrader Trading Tools
‍
Backtest Engine
My Trading Toolkit
Correlation Analysis
Seasonality
Market Prediction
Indicators & Data API
‍
Proprietary Indicators & Charts
Market Data API
Strategies & Scanner
‍
50+ Trading Strategies
Smart Stock Scanner
Smart Option Scanner
Research Reports
‍
Research Solutions
Reports Library
Free Resources
Simple Backtest Calculator
Simple Seasonality Calculator
The Kelly Criterion Calculator
Sentiment Geo Map
Public Research Reports
Education
Sentiment Indicators
Technical Indicators
Pricing
Company
About
In the News
Testimonials
Client Success Stories
Contact
Log inLoginSign up
< BACK TO ALL REPORTS

A resurgence in uptrends for value-oriented cyclical stocks

Dean Christians
2023-07-27
The market is witnessing a significant resurgence in value-oriented cyclical sector uptrends. This week, more than 90% of stocks in the Energy, Financials, Industrials, and Materials sectors closed above their 50-day average on the same day. Past occurrences of broad participation, like now, have historically led to above-average gains for the S&P 500 across all time frames.

Key points:

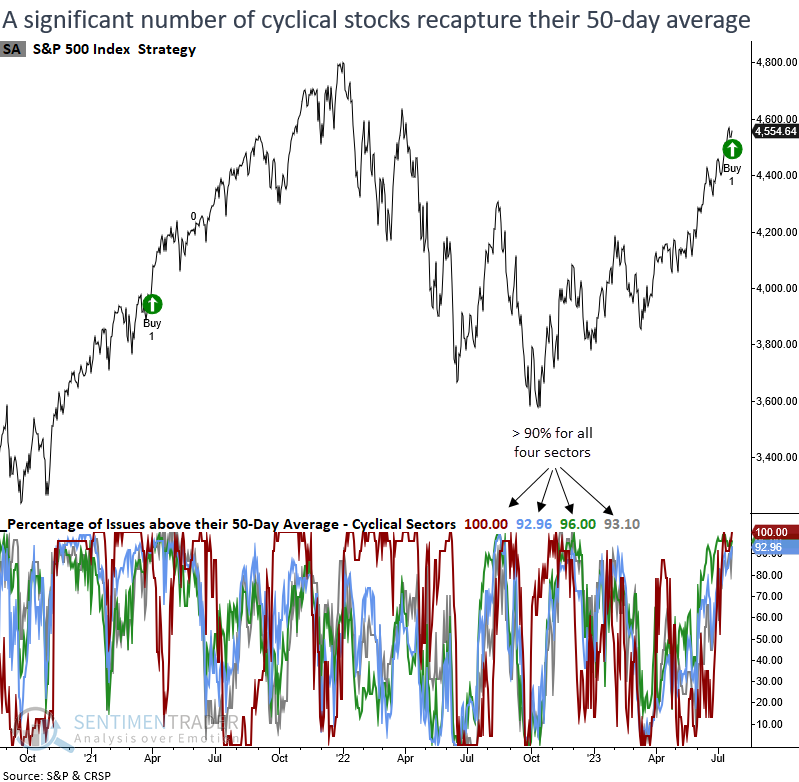
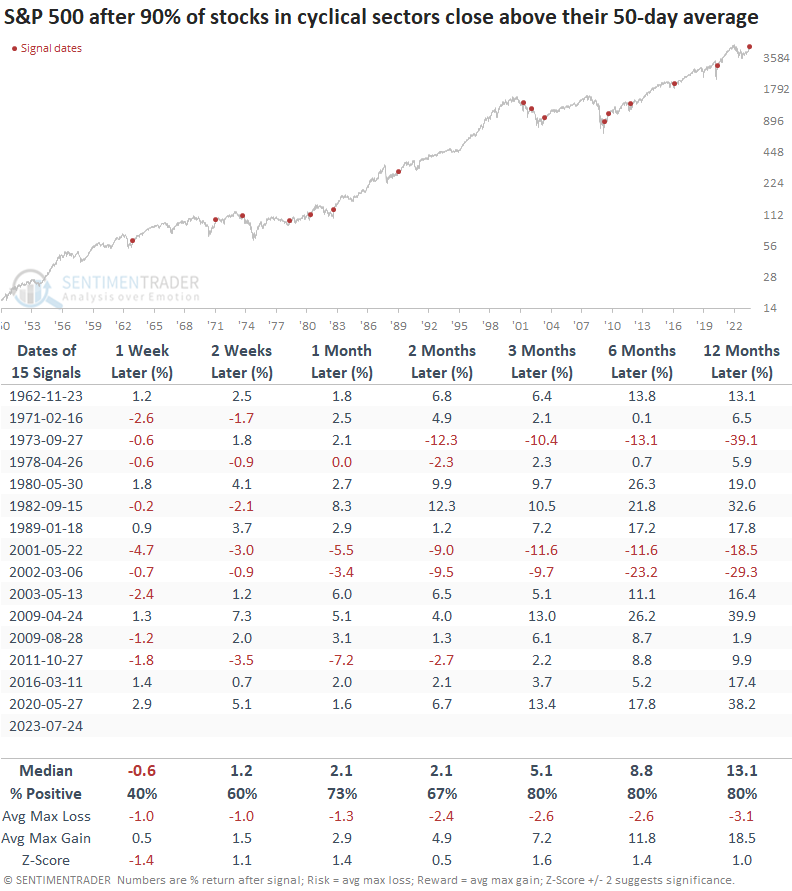
  • More than 90% of stocks in value-oriented cyclical sectors closed above their 50-day average 
  • Similar participation levels led to better than random returns in the S&P 500 over the next year
  • From a sector perspective, a rotation from growth to value looks unlikely 

Participation broadens in value-oriented cyclical stocks

We can remove the narrow market breadth wall of worry from our list of concerns.

For the first time since the low in October 2022, more than 90% of stocks in the Energy, Financials, Industrials, and Materials sectors closed above their respective 50-day average on the same day. 

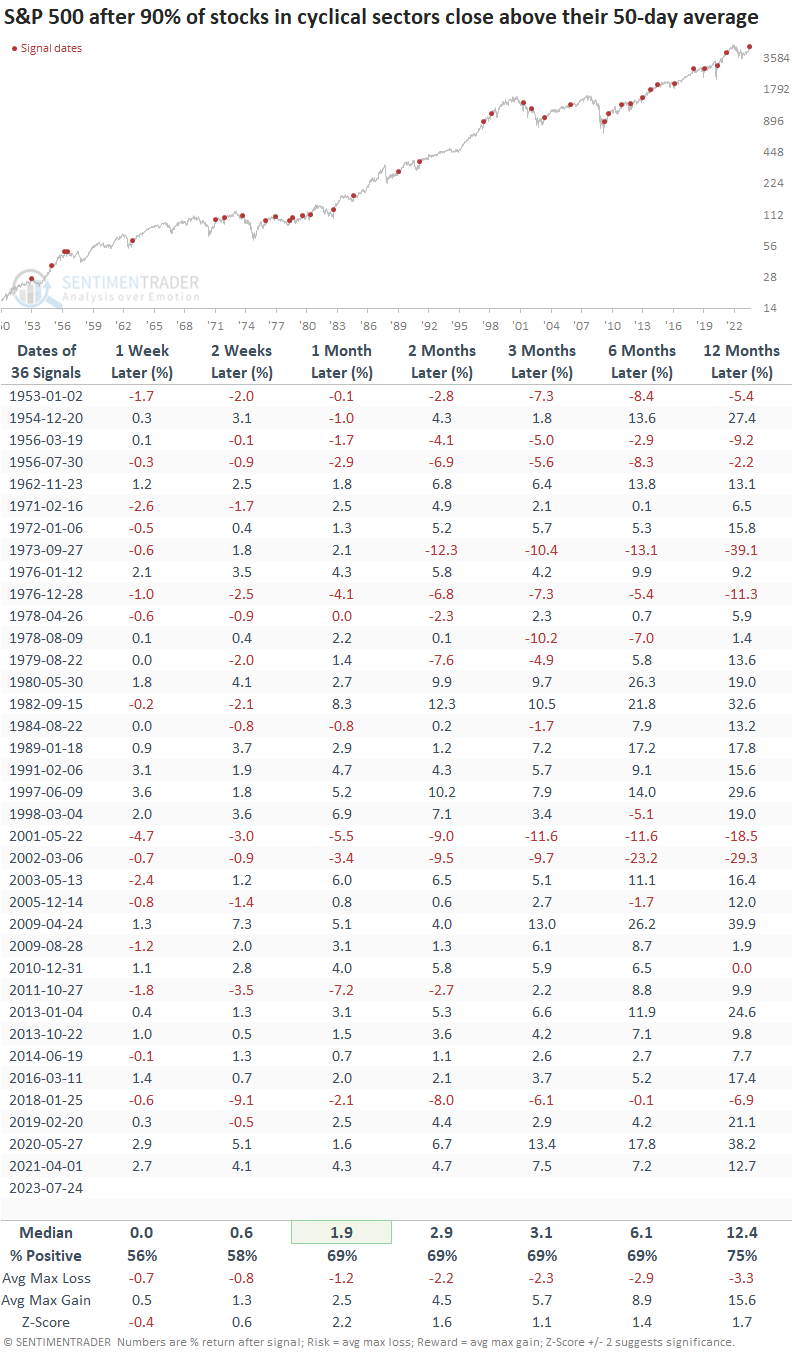
Similar participation levels preceded an upward bias in the S&P 500

When more than 90% of value-oriented cyclical sector stocks close above their 50-day average in unison, the S&P 500 tends to see additional gains that exceed the average return over the study period. Except for 1973 and the signals during the Dotcom bust, both of which took place in downtrends, drawdowns were reasonably modest.

Suppose we compare the forward returns for the value-oriented cyclical sectors to the S&P 500. In that case, there's not a lot of evidence to suggest that we should be thinking about rotating money to value despite the resurgence in uptrends.

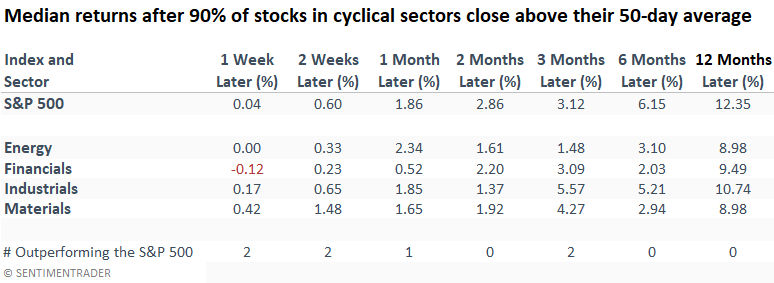
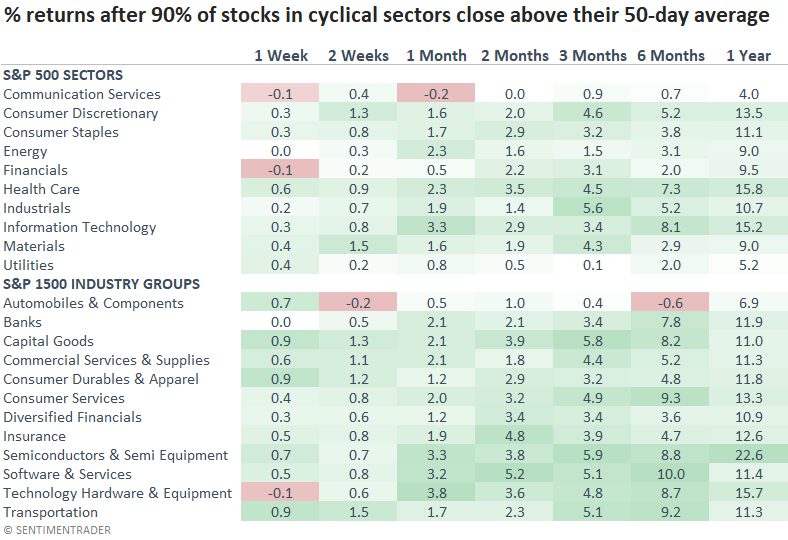
Growth-oriented sectors like Consumer Discretionary, Technology, and Health Care outperform all other groups on a fairly consistent basis.

The standout performer in the cyclical industry group category was undoubtedly semiconductors.

Additional context

By examining signals that occurred when the S&P 500 was down more than 5% from a 2-year high, similar to the current situation, returns and win rates improved relative to the original study results.

What the research tells us...

The current uptrend in the stock market is gaining momentum thanks to the growing participation of stocks from value-oriented cyclical sectors. This resurgence in value stocks is undoubtedly a positive sign for the overall market environment. However, while bullish, it does not suggest we should rotate from growth to value. For now, stay with what's working, Technology and Consumer Discretionary.

PRODUCTS
SentimenTrader
Trading Tools
Indicators & Data API
‍
Strategies & Scanner
‍
Research Reports
FREE
RESOUrCES
Simple Backtest
Calculator
Simple Seasonality
Calculator
The Kelly Criterion
Calculator
Sentiment Geo Map
‍
Public Research Reports
‍
Education
Sentiment Indicators
‍
Technical Indicators
‍
Pricing
Bundle pricing
‍
FAQ
‍
Announcements
‍
COMPANY
‍
About
‍
In the News
‍
Testimonials
‍
Client Success Stories
CONTACT
‍
General Inquiries
‍
Media Inquiries
‍
Financial Professionals Inquiries
‍
© 2026 Sundial Capital Research Inc. All rights reserved.
Setsail Marketing
TermsPrivacyAffiliate Program
Risk Disclosure: The information and tools provided are for research and analytical purposes only and are not intended as investment advice. Market analysis involves uncertainty, and outcomes may differ from expectations. Users should conduct their own due diligence and consider their individual circumstances before making any financial decisions. Past performance is not necessarily indicative of future results.

Hypothetical Performance Disclosure: Hypothetical performance results have many inherent limitations, some of which are described below. No representation is being made that any account will or is likely to achieve profits or losses similar to those shown; in fact, there are frequently sharp differences between hypothetical performance results and the actual results subsequently achieved by any particular trading program. One of the limitations of hypothetical performance results is that they are generally prepared with the benefit of hindsight. In addition, hypothetical trading does not involve financial risk, and no hypothetical trading record can completely account for the impact of financial risk of actual trading. for example, the ability to withstand losses or to adhere to a particular trading program in spite of trading losses are material points which can also adversely affect actual trading results. There are numerous other factors related to the markets in general or to the implementation of any specific trading program which cannot be fully accounted for in the preparation of hypothetical performance results and all which can adversely affect trading results.

Testimonial Disclosure: Testimonials appearing on this website may not be representative of other clients or customers and is not a guarantee of future performance or success.