
A real money sentiment indicator triggers a buy signal

Key points:
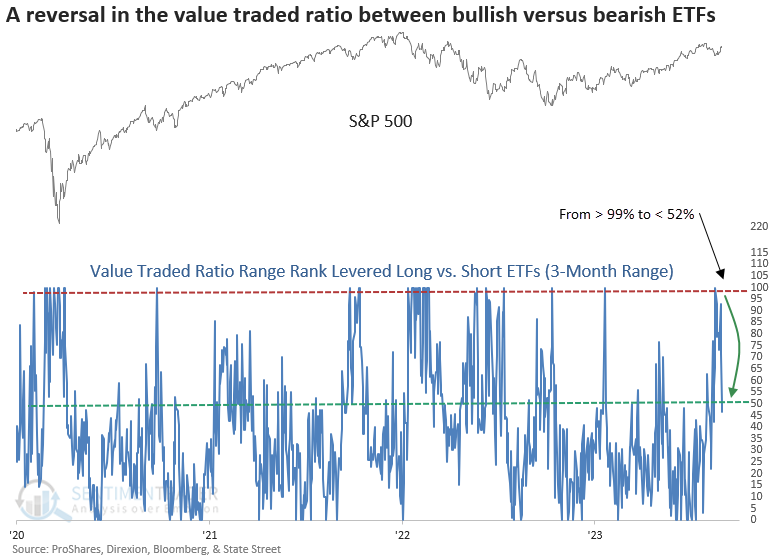
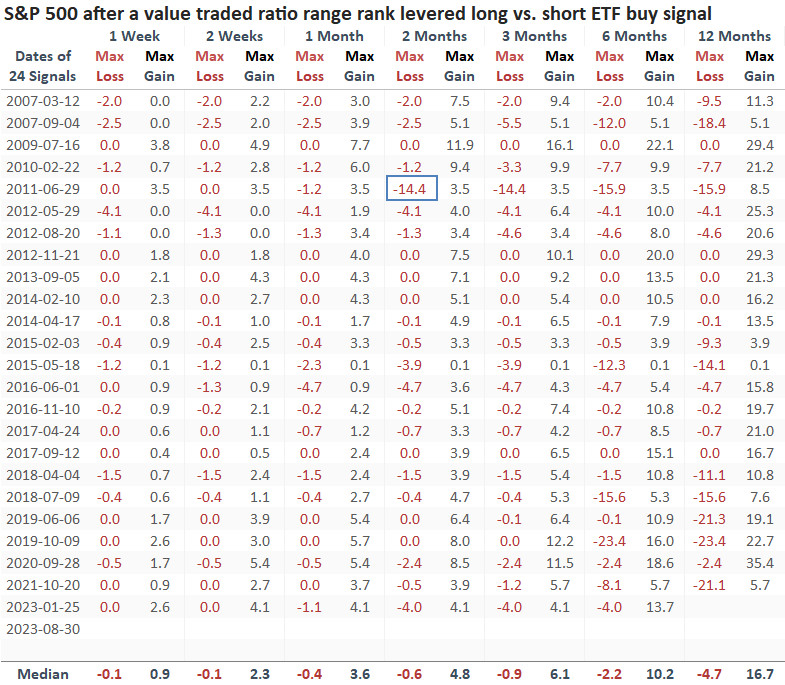
- The value traded ratio range rank for levered long versus short ETFs reversed from a pessimistic condition
- After similar shifts in investor sentiment, the S&P 500 rallied 83% of the time over the next two months
- During uptrends, the large-cap index rallied in 88% of cases over the subsequent two months
Sentiment amongst levered ETF traders reversed from a pessimistic extreme
One of the benefits associated with the financialization of the stock market is that it provides market participants with new and exciting indicators. Levered long and short ETFs are one of the more controversial new products. Still, traders can use them to their advantage as they provide a real money indication of investor behavior.
By summing the value traded for 2x and 3x levered long and short ETFs and calculating the ratio between traders that are bullish versus bearish, we can gauge market sentiment.
To capture the prevailing swings in market psychology, I created a model that applies a 3-month range rank to the value traded ratio between levered long versus short S&P 500 ETFs. When the range rank increases to the 99th percentile, indicating pessimism, and reverses below the 52nd percentile, the system triggers a buy alert as long as market momentum is positive.
With the market reversing from an almost -6% peak-to-trough correction in August, the model triggered a new buy signal this week.
Similar shifts in investor sentiment produced bullish outcomes
When the value traded ratio range rank for levered long versus short ETFs reverses lower after reaching a pessimistic condition, returns, win rates, and z-scores for the S&P 500 are excellent across all time horizons. While the model has benefited from a bull market environment, a handful of bear market signals showed a profit at some point in the first month.
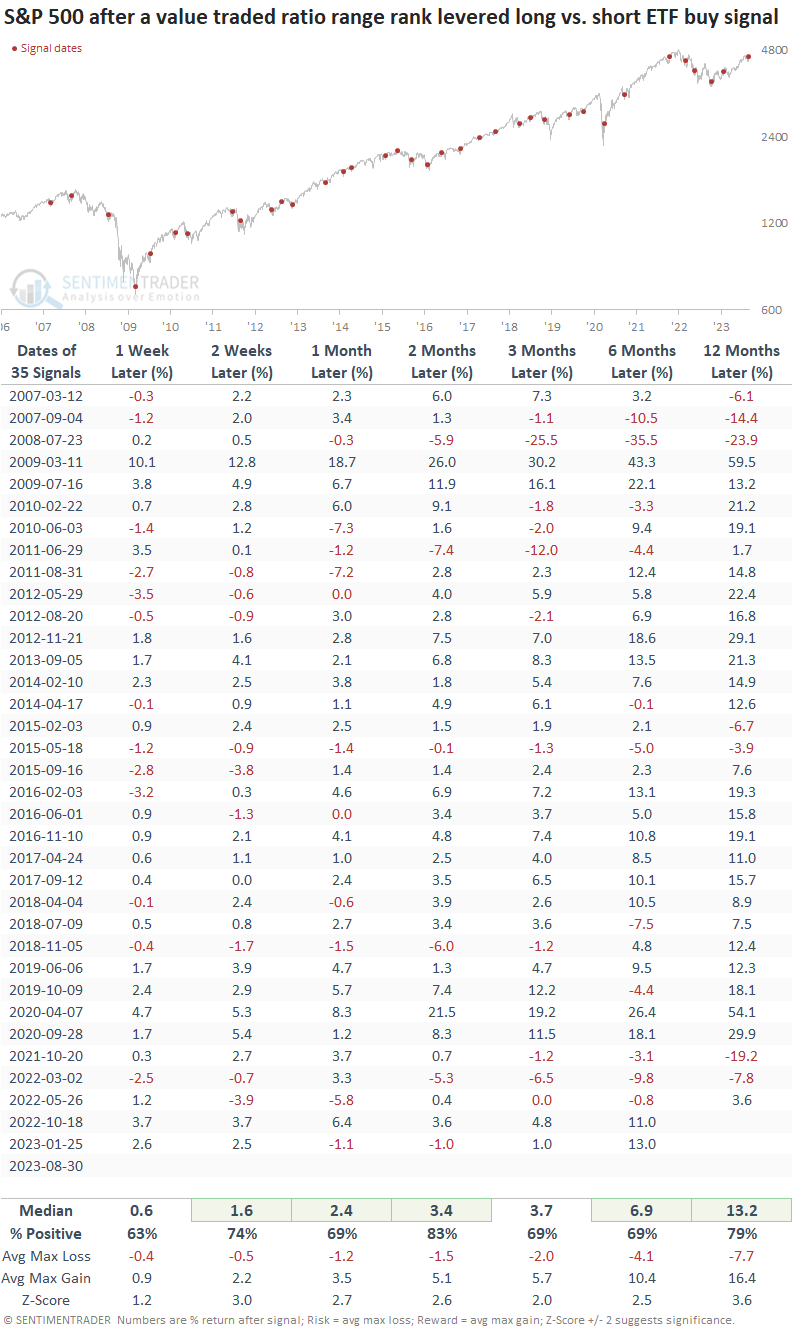
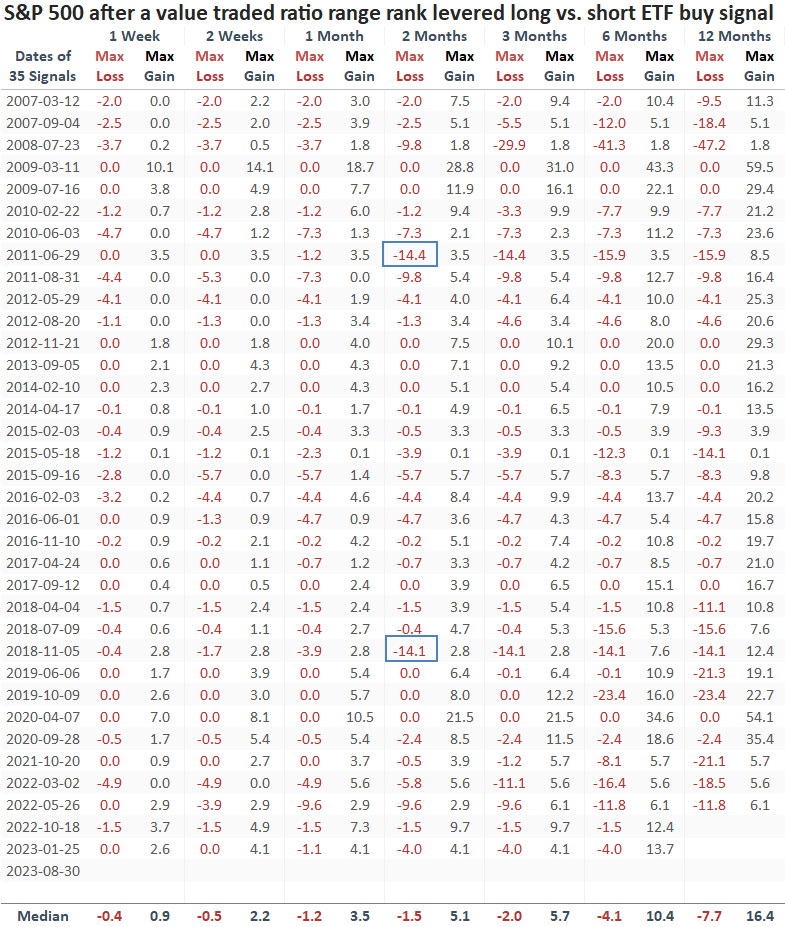
Significant drawdowns were rare over the next two months, with only 2 out of 35 precedents exceeding -10%.
Signals in an uptrend
When the S&P 500 maintained a bullish position above its 200-day average, the value traded range rank signals consistently demonstrated outstanding results across all time frames.
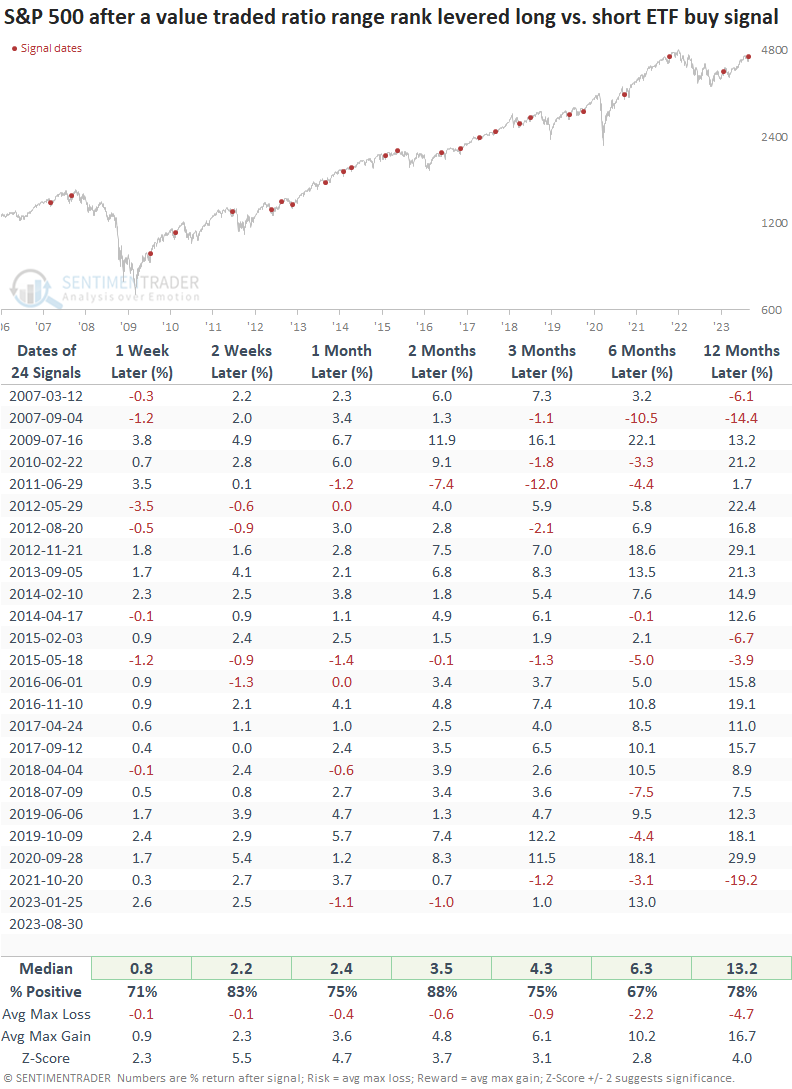
Signals that occurred in an uptrend were less likely to show a meaningful drawdown. Over the course of the next two months, there was only one instance where an alert displayed a max loss greater than -5%.
What the research tells us...
The value traded ratio range rank indicator for levered long versus short S&P 500 ETFs, a measure of market sentiment, increased to a pessimistic extreme over the last three months and reversed lower, triggering a buy signal for the world's most benchmarked index. After similar alerts, the S&P 500 rallied 83% of the time over the next two months, regardless of the market environment. When the signal occurred with the S&P 500 in an uptrend, like now, the large-cap index rallied 88% of the time over the subsequent two months.