
A ray of hope from Dumb Money Confidence

Key Points
- The stock market remains in a precarious situation
- Investors should pay close attention to price action and avoid trying to pick a market bottom
- That said, investors should also pay attention to important signs of a potential reversal
- Our Dumb Money Confidence indicator reached a level that suggests the potential for better days ahead at best, and an opportunity for bullish short-term traders at worst
Respecting the trend
As an aside, the chart below (courtesy of ProfitSource) displays the four major indexes along with their respective 200-day moving average.
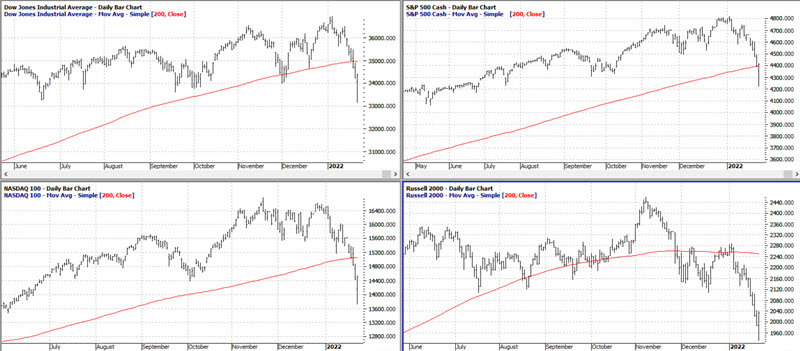
At the moment, all four of these indexes are below their respective 200-day moving average. This is an objective indication of a "downtrend." The hope is that this configuration will be short-lived and that the indexes will reverse quickly back to the upside, resulting in a "whipsaw" rather than the onset of a drawn-out bear market.
Nevertheless, as long as these indexes remain below their respective long-term moving average, investors are wise to stay cautious. The longer this state of affairs persists, the more likely we are in a significant bear market. Nevertheless, it is critically important to long-term success to not "stick one's head in the ground" and ignore hopeful signs as well as short-term trading opportunities.
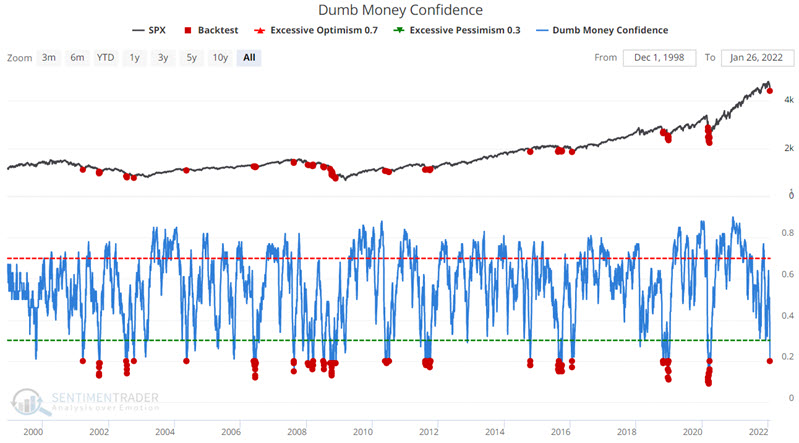
Dumb Money Confidence plunges
"Dumb Money" traders have proven themselves to be bad at market timing over history. They get bullish after a market rally and bearish after a market fall. By the time most of them catch on to a trend, it's too late - the trend is about to reverse. It tells us how confident we should be in selling the market. Examples of some Dumb Money indicators include the equity-only put/call ratio, the flow into and out of the Rydex series of index mutual funds, and small speculators in equity index futures contracts. Because the "dumb money" follows trends, they are usually correct during the meat of the trend but wrong at the extremes.
The chart below displays all day when Dumb Money Confidence showed a reading of 0.21 or less. You can run this test in the Backtest Engine.
The table below displays a summary of S&P 500 Index performance following the signal dates highlighted above.
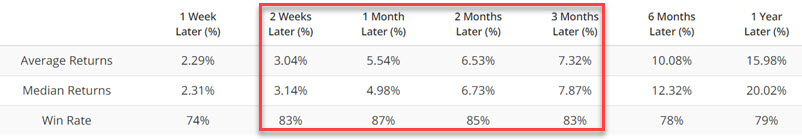
The Win Rates for two weeks to 3 months in the table above are impressive. Still, with the character of the market seemingly in a state of change - and with more significant concern about a potential bear market - it can be helpful to look at action during previous bear markets.
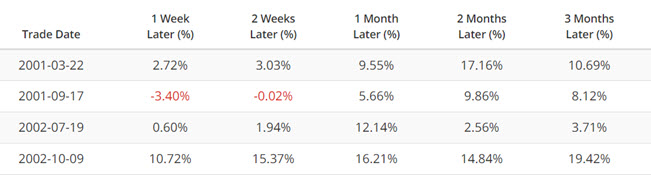
2000-2002
The chart below displays each time Dumb Money Confidence dropped to 0.21 or below for the first time in a month during the 2000-2002 bear market.
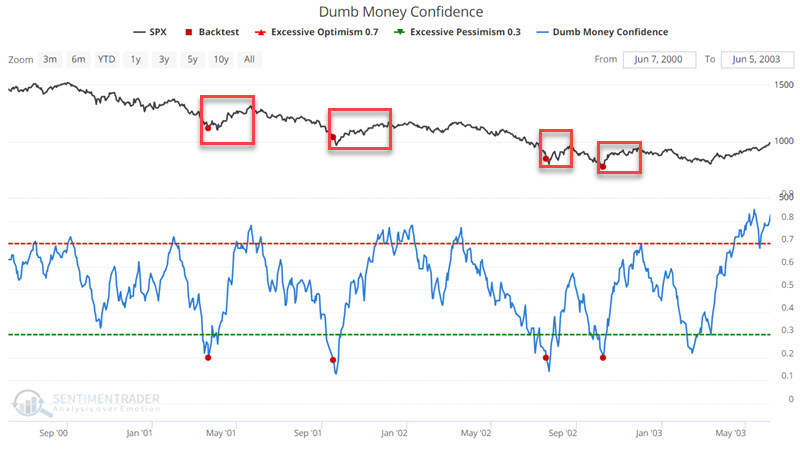
We see in the chart above that the signals did an excellent job of identifying short-term bullish trading opportunities, even in the context of a bear market. The table below displays the results from these signals numerically.
2007-2009
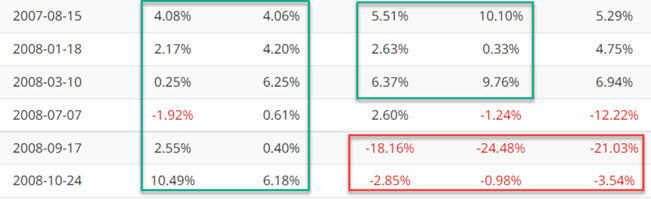
The chart below displays each time Dumb Money Confidence dropped to 0.21 or below for the first time in a month during the 2007-2009 bear market.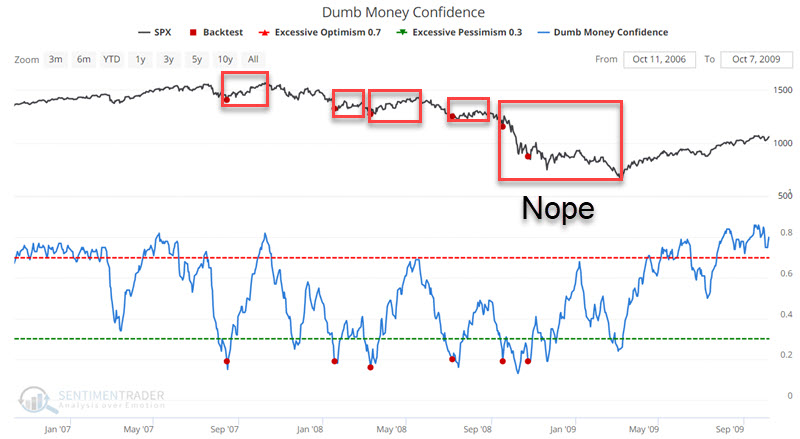
We see in the chart above that - once again - the early signals did an excellent job of identifying brief respites in a bear market. However, the signals in September and October 2008 were overwhelmed by the Great Financial Panic. The table below displays 1-week, 2-week, 1-month, 2-month, and 3-month results following the signals above.
What the research tells us...
The recent plunge in Dumb Money Confidence is favorable for the stock market. It represents a clear, objective sign of excessive bearishness among investors who are usually wrong at the extremes. Despite this, investors should recognize that this is just one sign and should be used as a part of a larger "weight of the evidence approach." Also, with the major stock market indexes in a bearish configuration (i.e., below their 200-day average), investors should recognize that any rallies that may follow a Dumb Money Confidence signal may be short-lived (i.e., two weeks to three months).