
A rare negative skew in the NYSE advance-decline ratio

Key points:
- Declining issues on the NYSE have outpaced advancing issues by a wide margin over the last four sessions
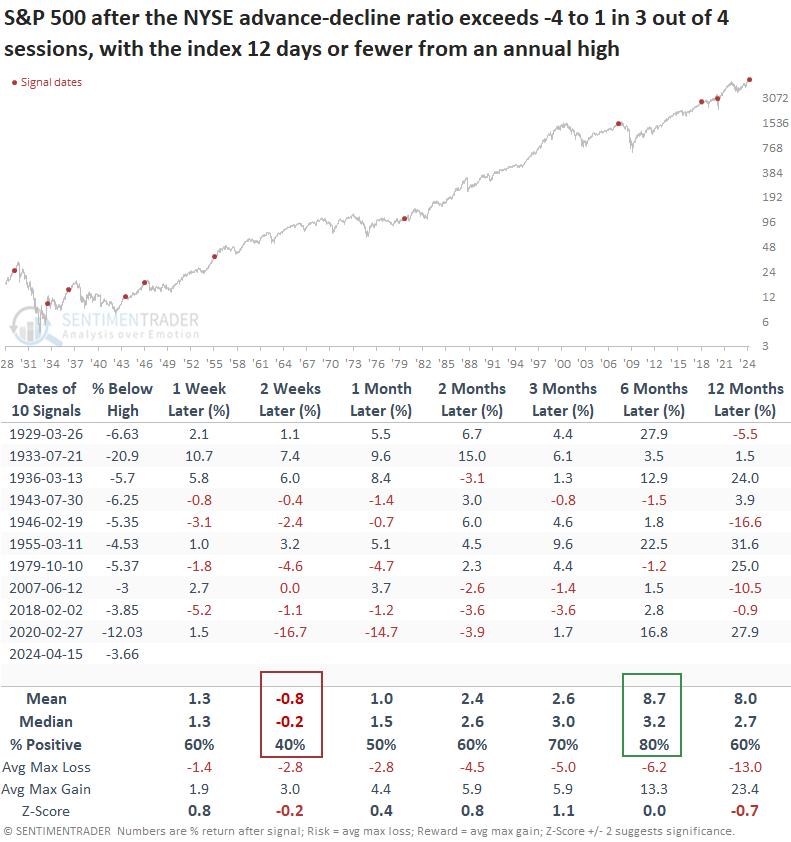
- Similar market breadth dynamics near a high led to negative returns over the following two weeks
- Six months later, the world's most benchmarked index was higher 80% of the time.
A daily measure of market breadth turns decidedly negative
Over the last four trading sessions, declining issues on the NYSE have exceeded advancing issues by a ratio of 5 to 1. Since 1928, this type of lopsided breadth has occurred only 48 times. Most of the precedents happened in the depths of signficant corrections and bear markets, not within 11 days of a high, like now.
If I include a condition that requires precedents to occur within 12 days of an S&P 500 annual high, the number of instances drops to seven, emphasizing the extraordinary nature of this event.
Given that a larger sample size is always preferable, I will adjust the advance-decline ratio threshold to 4 to 1, facilitating additional historical comparisons.
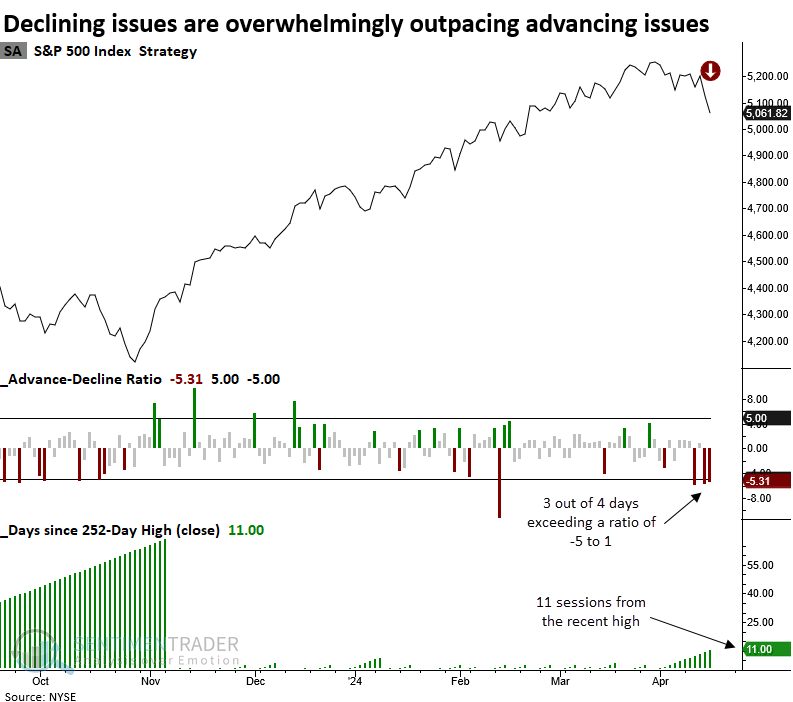
The chart above plots the advance-decline ratio as a negative value when declining issues exceed advancing issues.
Similar market breadth conditions preceded negative returns in the near term
When the advance-decline ratio overwhelmingly favors declining issues in 3 out of 4 sessions with the S&P 500 twelve or fewer days from a high, the world's most benchmarked index tends to struggle over the subsequent few weeks. At some point over the following two months, the large-cap index was negative in 7 out of 10 precedents.
More recent events are alarming, with all three precedents occurring just before or during signficant drawdowns.
Big-picture breadth
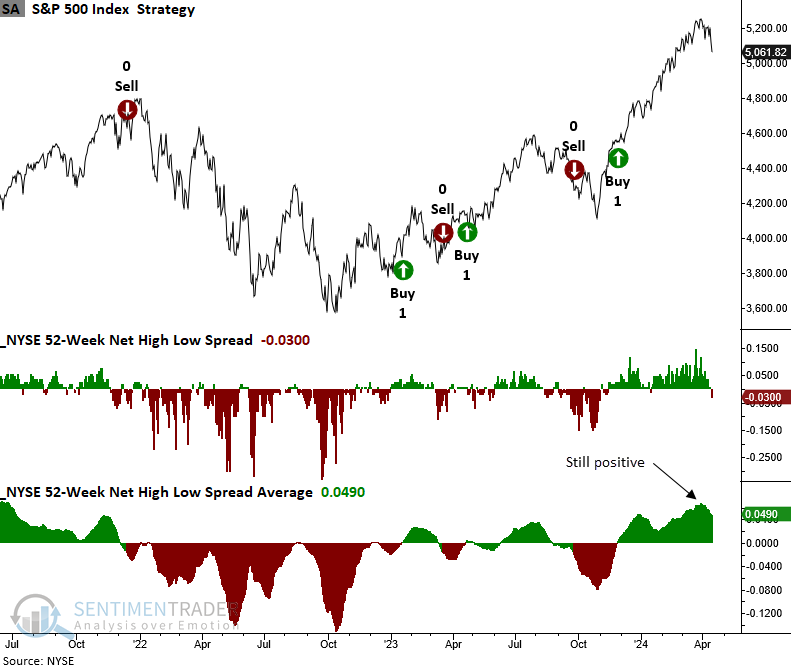
52-week lows are the most important indicator to monitor in a bull market, which is why they are a critical component in my TCTM Risk Warning Model.
While the spread between NYSE annual highs and lows turned negative on Monday, I prefer a moving average to eliminate the daily noise. A model that applies a 20-day average to the spread remains above the threshold level for a sell signal.
What the research tells us...
The daily advance-decline ratio for NYSE members turned decidedly negative over the last four sessions, with declining issues outpacing advancing issues by a ratio of 5 to 1 in three out of four days. Similar breadth skews preceded negative returns for the S&P 500 over the next few weeks. Six months later, the world's most benchmarked index was higher 80% of the time. While a handful of recent precedents occurred near or during bullish to bearish trend changes, corroborating evidence from big-picture indicators does not support a significant risk-off scenario. In all likelihood, higher rates, sticky inflation, and global events provide the impetus for the typical consolidation or correction within an ongoing bull market.