
A rapid steepening in the yield curve

Key points:
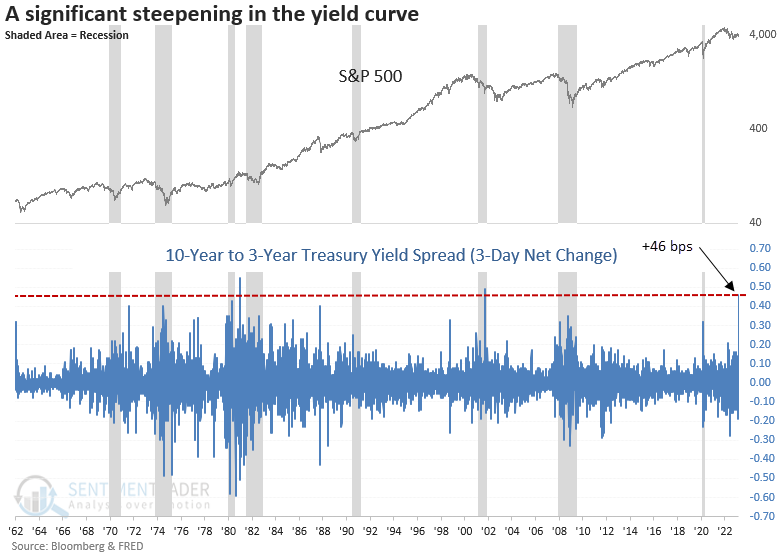
- The 10-year to 3-year Treasury yield spread increased by 46 bps over three days
- After similar spread changes, stocks showed modest gains over the next three months
- Commodities and the dollar index struggled, gold rose marginally, and yields declined
What does the swift steepening in the yield curve foreshadow
The trouble in the banking sector in the last week sent stocks tumbling and short-dated yields like the two and 3-year plunging at one of the swiftest rates in history. As my note on Monday showed, panics typically create an opportunity that differs from what one might expect based on a subjective view. Analysis-over-emotion leads to better outcomes.
With investors buying short-dated Treasuries hand over fist on the narrative that another financial crisis is upon us and the Federal Reserve will reverse its policy stance, the yield curve steepened by the 3rd most significant amount in history.
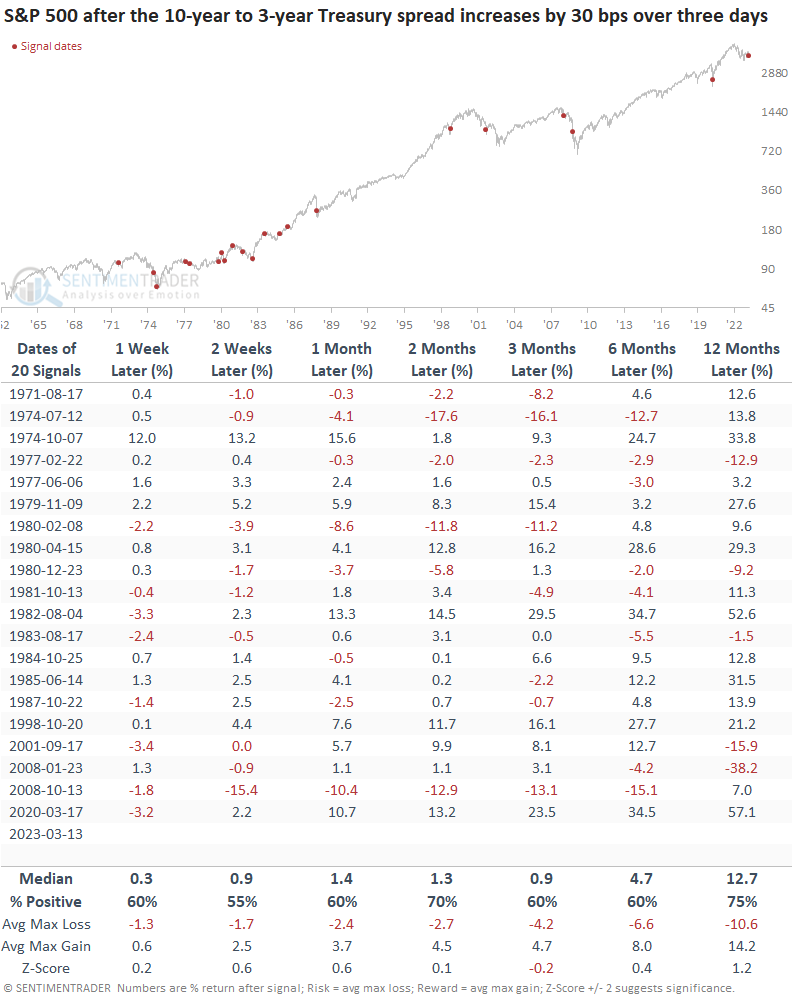
Let's assess the outlook for stocks and other asset classes when the 10-year to 3-year Treasury yield spread increases by 30 bps over three days. I lowered the net change level to capture more historical instances. And I used the 3-year Treasury instead of the more popular 2-year Treasury because it has more history.
Similar rapid increases in the spread preceded modest returns for the S&P 500
When the 10-year to 3-year Treasury spread increases by 30 bps over three days, the S&P 500 shows modest gains over the next three months. Except for a few signals, long-term results look constructive.
Since 1987, the signal typically occurred around panic-driven events. Before that, the curve steepening was more common as interest rates were volatile during a high inflation environment.
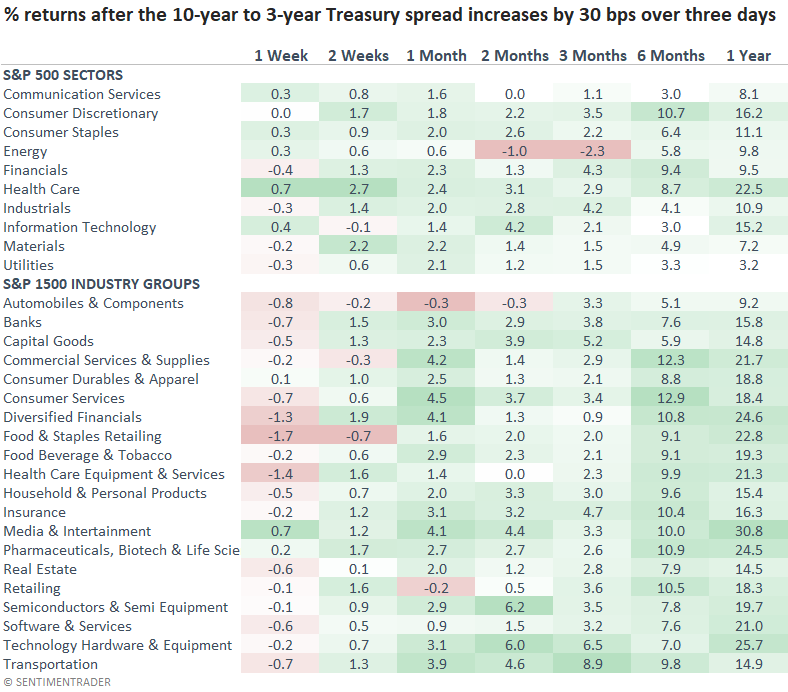
The return profile for sectors looks similar to the S&P 500, with modest gains over the next few months. However, industry groups show somewhat soft results in the near term. I suspect that's due to the impact of mid and small-cap company weightings in the indexes.
Long-term results look solid for sectors and industries with a more offensive tilt.
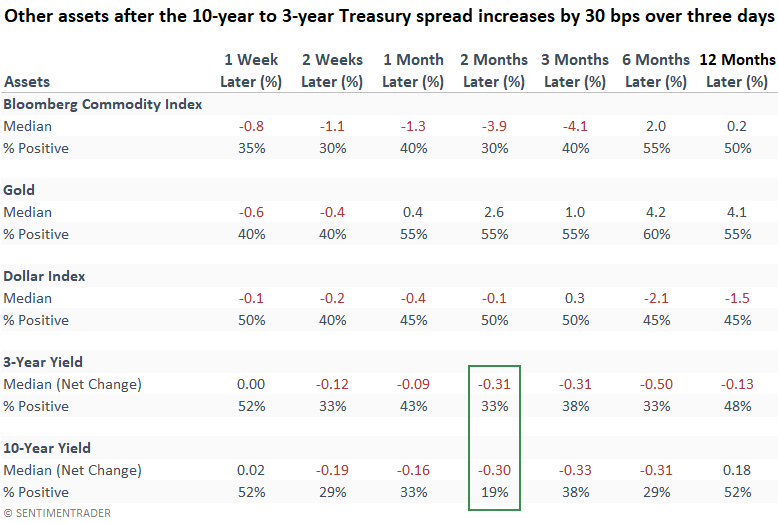
Other asset classes
Interestingly, the steepening of the yield curve does not foreshadow a flight to safety in the Dollar Index. Usually, a weak dollar provides a tailwind for commodities, but not with this signal. While gold returns and win rates are favorable on a medium and long-term basis, it doesn't excite me. A bet on falling yields looks compelling.
What the research tells us...
Investors are panicked, and rightfully so, given the volatility in stocks and bonds. Remember, staying calm and making rational decisions based on objective data analysis leads to better investing outcomes. While scary, the swift increase in the 10-year to 3-year Treasury spread does not portend the death of equities as some would suggest. However, suppose this time turns out to be like 1974 or 2008. In that case, I recommend holding short-dated Treasuries or T-Bills in a portfolio.