Data &
Technology
Research
Reports
Report Solutions
Reports Library
Actionable
Strategies
Free
Resources
Simple Backtest Calculator
Simple Seasonality Calculator
The Kelly Criterion Calculator
Sentiment Geo Map
Public Research Reports
Free Webinar
Pricing
Company
About
Meet Our Team
In the News
Testimonials
Client Success Stories
Contact
Log inLoginSign up
< BACK TO ALL REPORTS

A rally so broad, even the weak are strong

Jason Goepfert
2020-12-21
The rally in stocks has been so broad that the median sector has 95% of its stocks above their 200-day moving averages.

The breadth of the advance continues to be impressive. Out of the 10 major S&P 500 sectors, the median one has more than 95% of its member stocks in an uptrend. That's the most in almost a decade.

Only about 1% of days over the past 30 years have seen participation this wide across sectors. Not only does the median sector have almost every one of its stocks in an uptrend, even the worst sector recently had more than 80% of its stocks above their 200-day moving averages.

worst sector % of members in uptrends 200 day average

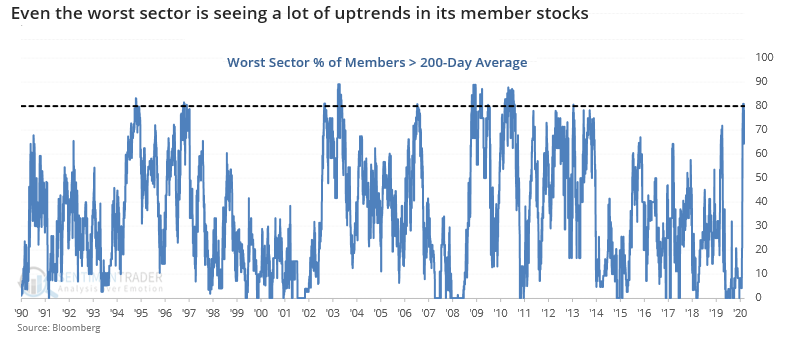
It's rare to see even the worst laggard among sectors see such widespread uptrends among its stocks, occurring on about 2% of all days. Over the past 30 years, there have only been 23 days when the median sector had at least 95% of its members in uptrends, and even the worst sector had at least 75% participation.


What else is happening

These are topics we explored in our most recent research. For immediate access with no obligation, sign up for a 30-day free trial now.

  • Returns in the S&P when the median and worst sector have most stocks in uptrends
  • Sector and factor performance after broad sector participation - cyclical stocks, whew
  • Analog comparisons to the highest-correlated 9-month rallies off major lows since 1896
  • What happens after the most similar rallies hit the 9-month mark

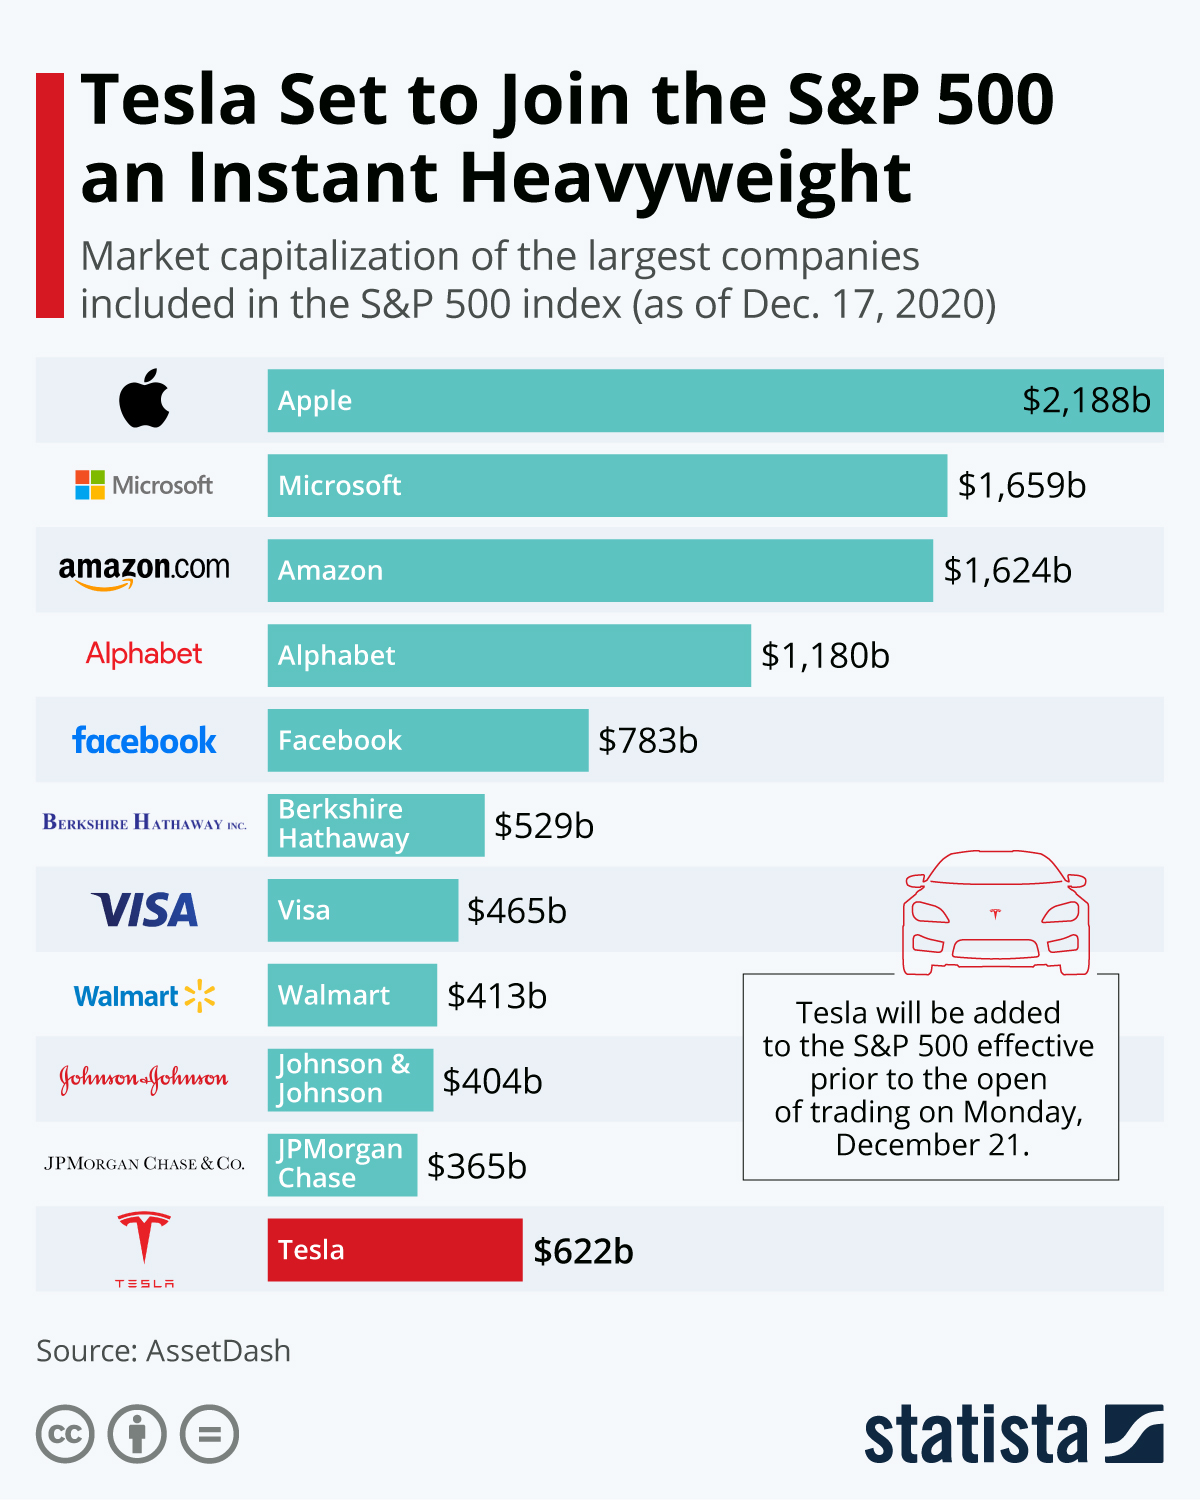
Stat Box

Based on research we published last month, when the largest market cap stocks since the 1970s were added to the S&P 500, they had a strong tendency to see gains after the announcement date of their addition. But once they were actually added to the index, they showed a positive return over the next 3 months only 41% of the time, a caution sign for Tesla shareholders.

Sentiment from other perspectives

We don't necessarily agree with everything posted here - some of our work might directly contradict it - but it's often worth knowing what others are watching.

1. On its first day in the most benchmarked index in the world, Tesla became the fastest-ever stock to become such a big influence. [Eric Balchunas]

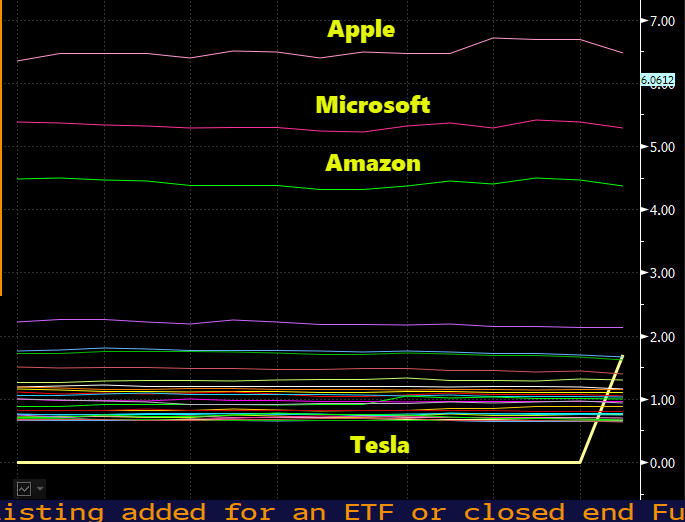
2. Tesla is also going to have one of the biggest market caps of any stock in the index. Or any stock, period. [Statista]

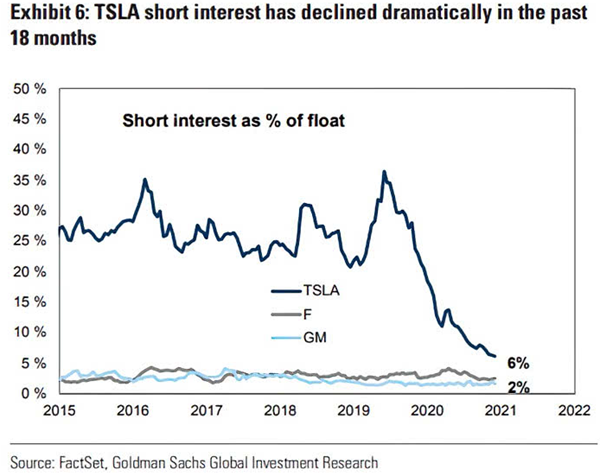
3. The stock is such a behemoth that it has burned short-sellers, and few have the derring-do to keep betting against it. [Goldman Sachs]

DATA &
TECHnologies
IndicatorEdge
‍
BackTestEdge
‍
Other Tools
‍
DataEdge API
RESEARCH
reports
Research Solution
‍
Reports Library
‍
actionable
Strategies
Trading Strategies
‍
Smart Stock Scanner
‍
FREE
RESOUrCES
Simple Backtest
Calculator
Simple Seasonality
Calculator
The Kelly Criterion
Calculator
Sentiment Geo Map
‍
Public Research Reports
‍
Free Webinar
COMPANY
‍
About
‍
Meet our Team
‍
In the News
‍
Testimonials
‍
Client Success Stories
Pricing
Bundle pricing
‍
Announcements
‍
FAQ
© 2024 Sundial Capital Research Inc. All rights reserved.
Setsail Marketing
TermsPrivacyAffiliate Program
Risk Disclosure: Futures and forex trading contains substantial risk and is not for every investor. An investor could potentially lose all or more than the initial investment. Risk capital is money that can be lost without jeopardizing ones’ financial security or life style. Only risk capital should be used for trading and only those with sufficient risk capital should consider trading. Past performance is not necessarily indicative of future results.

Hypothetical Performance Disclosure: Hypothetical performance results have many inherent limitations, some of which are described below. No representation is being made that any account will or is likely to achieve profits or losses similar to those shown; in fact, there are frequently sharp differences between hypothetical performance results and the actual results subsequently achieved by any particular trading program. One of the limitations of hypothetical performance results is that they are generally prepared with the benefit of hindsight. In addition, hypothetical trading does not involve financial risk, and no hypothetical trading record can completely account for the impact of financial risk of actual trading. for example, the ability to withstand losses or to adhere to a particular trading program in spite of trading losses are material points which can also adversely affect actual trading results. There are numerous other factors related to the markets in general or to the implementation of any specific trading program which cannot be fully accounted for in the preparation of hypothetical performance results and all which can adversely affect trading results.

Testimonial Disclosure: Testimonials appearing on this website may not be representative of other clients or customers and is not a guarantee of future performance or success.