Data &
Technology
Research
Reports
Report Solutions
Reports Library
Actionable
Strategies
Free
Resources
Simple Backtest Calculator
Simple Seasonality Calculator
The Kelly Criterion Calculator
Sentiment Geo Map
Public Research Reports
Free Webinar
Pricing
Company
About
Meet Our Team
In the News
Testimonials
Client Success Stories
Contact
Log inLoginSign up
< BACK TO ALL REPORTS

A quick reversal in the Nasdaq McClellan Oscillator

Jason Goepfert
2022-03-21
After reaching an extreme oversold threshold, internal momentum via the McClellan Oscillator on the Nasdaq exchange has cycled into the opposite extreme. That tends to indicate sustained strength. As does the 4 consecutive days with larger than 1% gains, seen only one other time in the index's history.

Key points:

  • Internal momentum on the Nasdaq has cycled from extreme oversold to extreme overbought
  • That has tended to precede sustained rallies (with 2 major exceptions)
  • The four straight 1% gains in the Composite argue against a failure

Internals have cycled from one extreme to the other

Ever since we looked at the disaster among stocks trading on the Nasdaq exchange, we've been looking for signs of a recovery. Few signs are better than a thrust of buyers returning quickly and en masse.

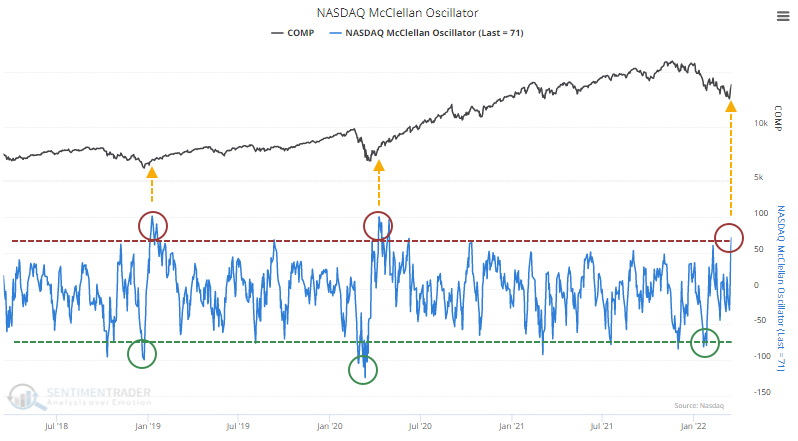
There are nascent signs we're seeing that now. The McClellan Oscillator for the Nasdaq has cycled from below -70 to above +70. Over the past 5 years, it has done this only 2 other times, preceding sustained rallies.

The Nasdaq Composite's returns following all similar reversals over the past 40 years were good, with 14 out of 17 signals showing a positive one-year return, which averaged a robust 17%.

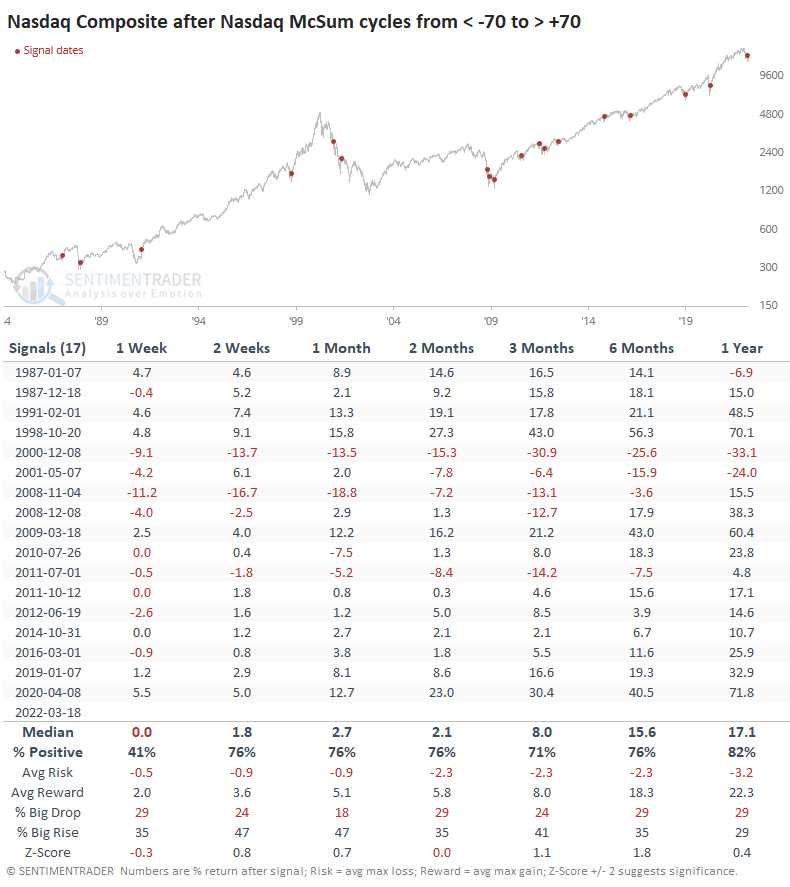
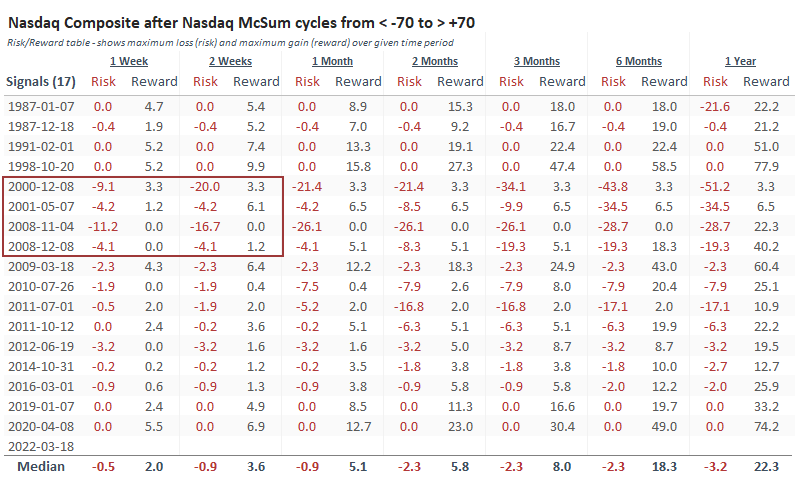
The biggest issue is the post-bubble bear market. That, and the financial crisis, were the only times when sellers returned immediately and in force. It could be argued that it happened in June 2012, which was a false failure.

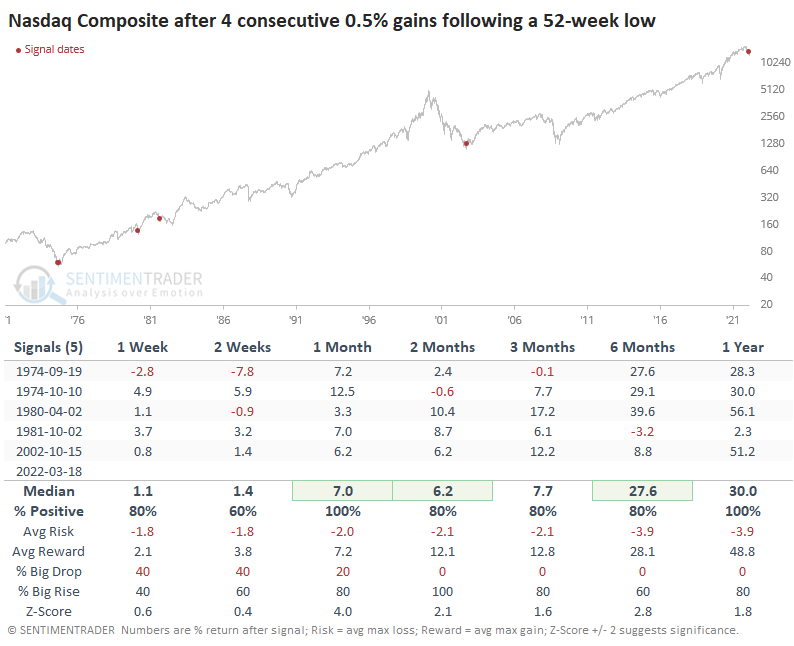
The thrust in price has been impressive and nearly unprecedented. The only other time in its history when the Nasdaq Composite closed at a 52-week low then enjoyed 4 consecutive days with larger than 1% gains was in April 1980. That ended up leading to a further gain of 56% during the following year.

Even if we look at "only" gains of 0.5% on back-to-back-to-back-to-back days, there are few precedents, all leading to further gains.

What the research tells us...

Since we're in the aftermath of a speculative bubble, similar to the 2000-2002 bear market, we need to be on the lookout for high volatility and rally failures. There were multiple false bottoms during that stretch. The persistent follow-through last week was impressive, and it's been an excellent sign in the past. Not only the Composite index rallied, but also many of the member stocks. If we see immediate and heavy selling pressure in the week(s) ahead, then the probability will rise dramatically that there is a long slog ahead.

Sorry, you don't have access to this report

Upgrade your subscription plan to get access
Go to Dasboard
DATA &
TECHnologies
IndicatorEdge
‍
BackTestEdge
‍
Other Tools
‍
DataEdge API
RESEARCH
reports
Research Solution
‍
Reports Library
‍
actionable
Strategies
Trading Strategies
‍
Smart Stock Scanner
‍
FREE
RESOUrCES
Simple Backtest
Calculator
Simple Seasonality
Calculator
The Kelly Criterion
Calculator
Sentiment Geo Map
‍
Public Research Reports
‍
Free Webinar
COMPANY
‍
About
‍
Meet our Team
‍
In the News
‍
Testimonials
‍
Client Success Stories
Pricing
Bundle pricing
‍
Announcements
‍
FAQ
© 2024 Sundial Capital Research Inc. All rights reserved.
Setsail Marketing
TermsPrivacyAffiliate Program
Risk Disclosure: Futures and forex trading contains substantial risk and is not for every investor. An investor could potentially lose all or more than the initial investment. Risk capital is money that can be lost without jeopardizing ones’ financial security or life style. Only risk capital should be used for trading and only those with sufficient risk capital should consider trading. Past performance is not necessarily indicative of future results.

Hypothetical Performance Disclosure: Hypothetical performance results have many inherent limitations, some of which are described below. No representation is being made that any account will or is likely to achieve profits or losses similar to those shown; in fact, there are frequently sharp differences between hypothetical performance results and the actual results subsequently achieved by any particular trading program. One of the limitations of hypothetical performance results is that they are generally prepared with the benefit of hindsight. In addition, hypothetical trading does not involve financial risk, and no hypothetical trading record can completely account for the impact of financial risk of actual trading. for example, the ability to withstand losses or to adhere to a particular trading program in spite of trading losses are material points which can also adversely affect actual trading results. There are numerous other factors related to the markets in general or to the implementation of any specific trading program which cannot be fully accounted for in the preparation of hypothetical performance results and all which can adversely affect trading results.

Testimonial Disclosure: Testimonials appearing on this website may not be representative of other clients or customers and is not a guarantee of future performance or success.