
A prolonged decline in the 200-day moving average looks troubling

Key points:
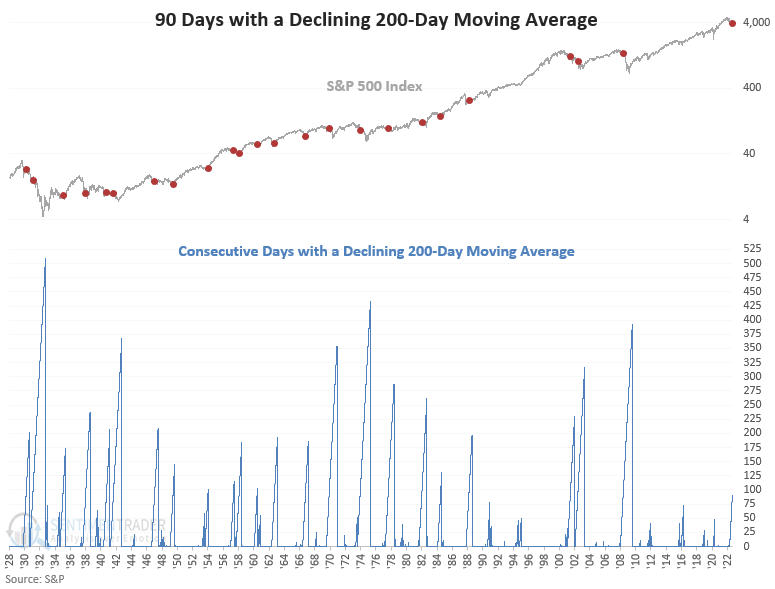
- The 200-day moving average for the S&P 500 has declined for 90 consecutive days
- After similar downtrends, the S&P 500 was negative six months later
- A review of momentum, Fed policy, and economic data provides some unique perspective
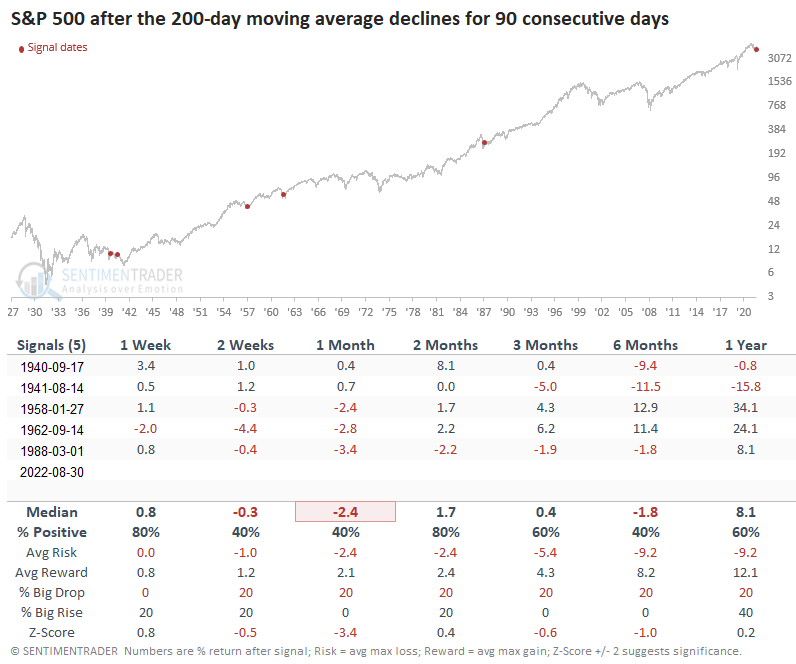
The S&P 500 remains in an established downtrend
In recent notes, I've shared some studies that suggested the broad market could struggle in the next few months. One of the critical conditions I applied to the studies has been the declining 200-day moving average-context matters.
With the 200-day moving average for the S&P 500 declining for 90 consecutive days this week, let's assess the outlook for the index after other persistent declines in one of the most widely followed price trend indicators.
For only the 24th time since 1928, the 200-day moving average for the S&P 500 declined for 90 consecutive days.
Similar long-term downtrends preceded negative returns six months later
While most short- to medium-term time frames suggest somewhat flat returns, the six-month window looks troubling, especially the win rate and z-score. Signals since 1969 show a consistent pattern of negative returns across all time frames, with the 2-week window showing a loss in all nine instances.
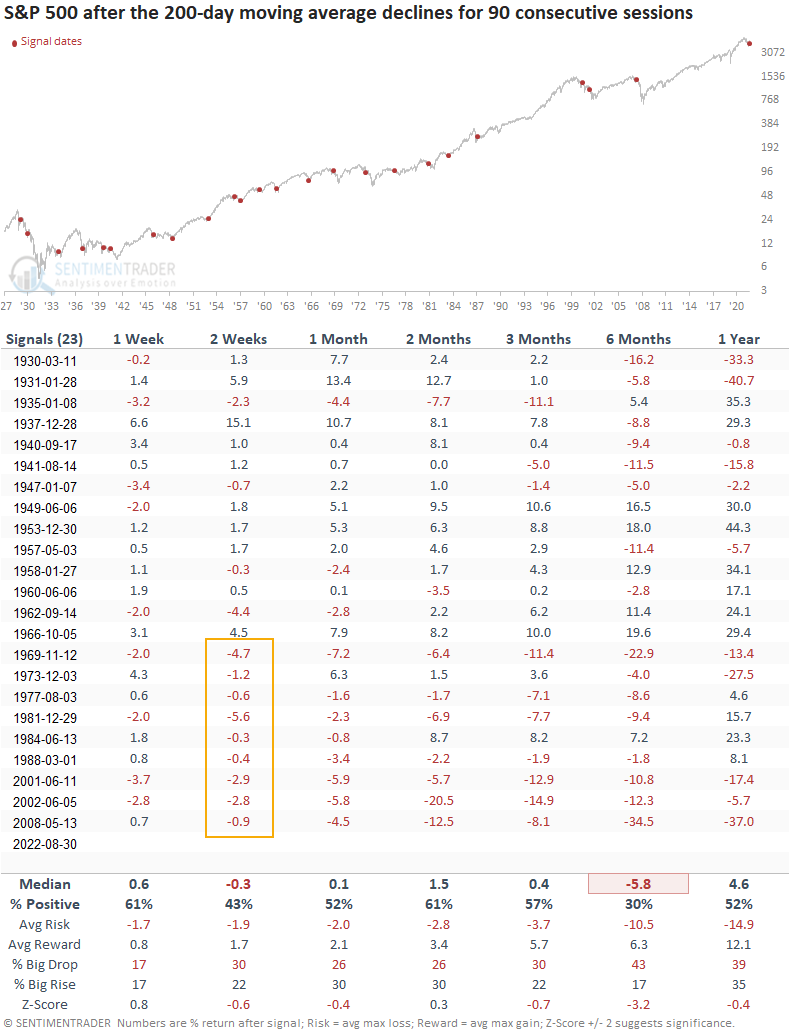
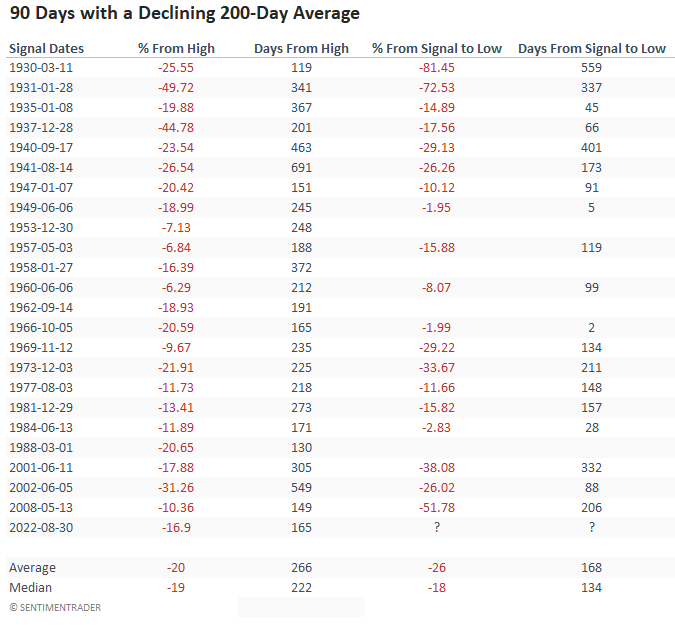
The most recent signal occurred with the S&P 500 down 17% from its peak in January. And the duration count shows 165 days. Both stats are less than the average and median for all instances.
Suppose we measure performance from the signal date to the ultimate low. In that case, the median loss was 18%, and the duration was slightly over six months. 1953, 1958, 1962, and 1988 are instances where the S&P 500 never closed below the previous low.
A historical perspective looking at momentum
With the recent signal from the TCTM composite thrust model, let's see if we can gain any information by reviewing the signal count at the time of a 90-day alert. Most cases did not coincide with an elevated momentum thrust signal count.
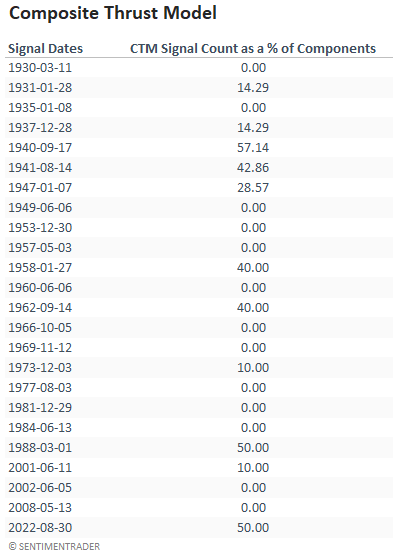
Suppose I isolate the 200-day average signals that coincided with a TCTM composite signal count of 40% or greater. In that case, we see five other instances since 1940. While the return outlook is a mixed bag across most time frames, we see some notable occurrences around significant bottoms.
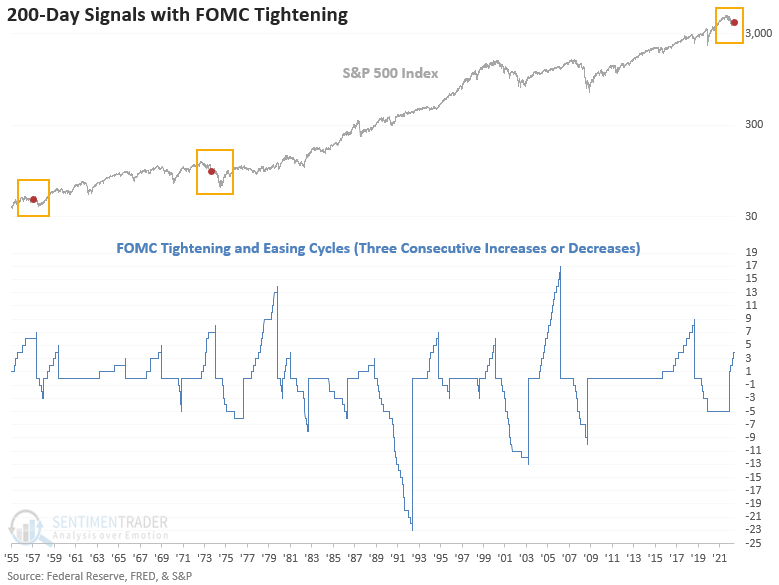
A historical perspective looking at FOMC policy
It's not unprecedented to see a 200-day average signal coincide with a tightening cycle from the FOMC. However, most of the time, we see a neutral or easy Fed. While the previous instances occurred during multi-year bear markets, the drawdown difference between the two is notable.
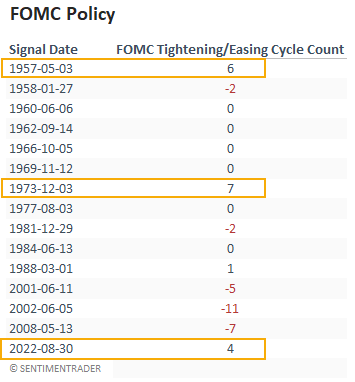
The 1957-58 bear market saw the S&P 500 decline by almost 22%, whereas the 1973-74 bear market recorded a drawdown of 48%.
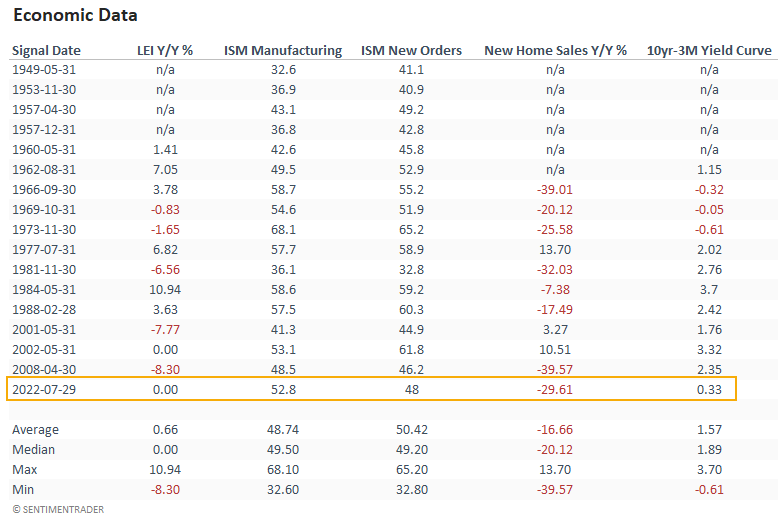
A historical perspective looking at economic data
Besides new home sales, economic data looks somewhat in line with historical levels at the time of a 200-day average signal. The yield curve is concerning, especially since an additional hike in September is almost guaranteed.
I adjusted the daily signal dates to reflect the previous month-end data. Due to data limitations, the table contains fewer signals than the original study.
What the research tells us...
The S&P 500 remains mired in an established downtrend, which suggests a potentially unfavorable outcome. Using history as a guide, we need to mentally prepare ourselves for what could be a more extended drawdown phase. The Fed remains steadfast in its commitment to bringing down inflation, even if that means stocks and the economy suffer. So, we must keep an open mind to various outcomes and manage risk appropriately.