
A persistently low VIX suggests a bullish backdrop for stocks

Key points:
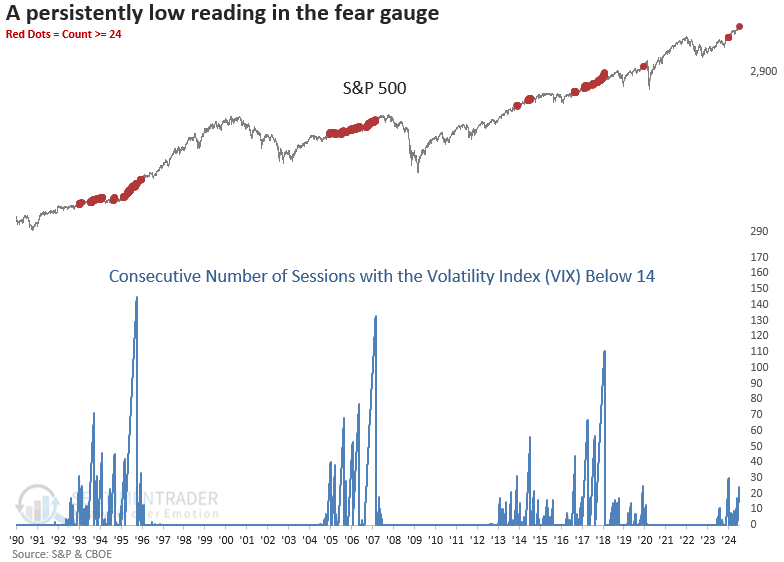
- The CBOE Volatility Index (VIX) closed below 14 for 24 consecutive trading sessions
- Similar periods with persistently low expected volatility preceded excellent returns for the S&P 500
- The VIX tended to rise following similar patterns, and seasonality is about to turn unfavorable
The fear gauge continues to exhibit characteristics associated with stock market uptrends
In May, I pointed out that the CBOE Volatility Index, commonly known as the fear gauge, had dipped below 12, a rarity seen just 9% of the time since 1990. The analysis suggested that while volatility would rise from this low point, it would remain within a range. Now, almost two months later, this has indeed been the case.
Over the last 24 trading sessions, the Volatility Index (VIX) has closed below 14 on consecutive days, a rare occurrence that has only happened 23 other times in history. The previous instance occurred in December 2023, which resulted in a 15% gain in the S&P 500 over the subsequent six months.
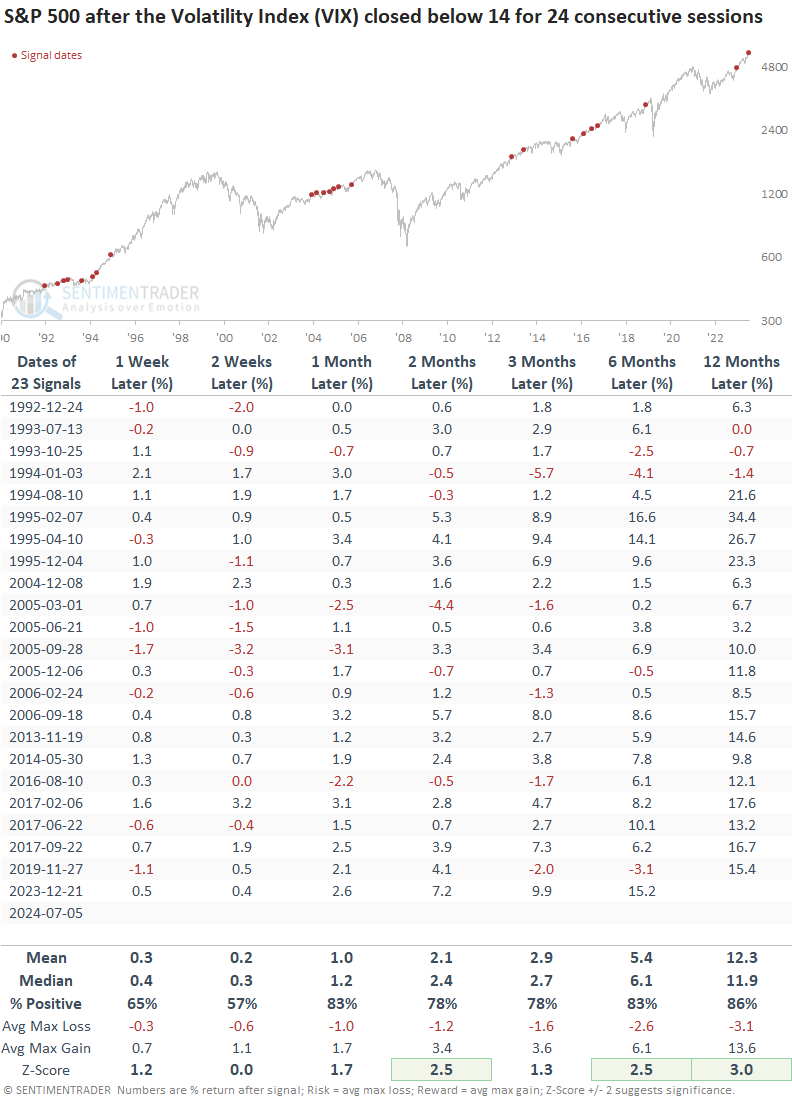
Extended periods of low expected volatility usually result in positive stock returns
Whenever the Volatility Index (VIX) closed below 14 for 24 consecutive sessions, the world's most benchmarked index displayed excellent returns and consistency over the following year.
In the next two months, the maximum gain exceeded the maximum loss in 19 out of 23 instances, and only once did the maximum loss exceed -5%, reaching -6%.
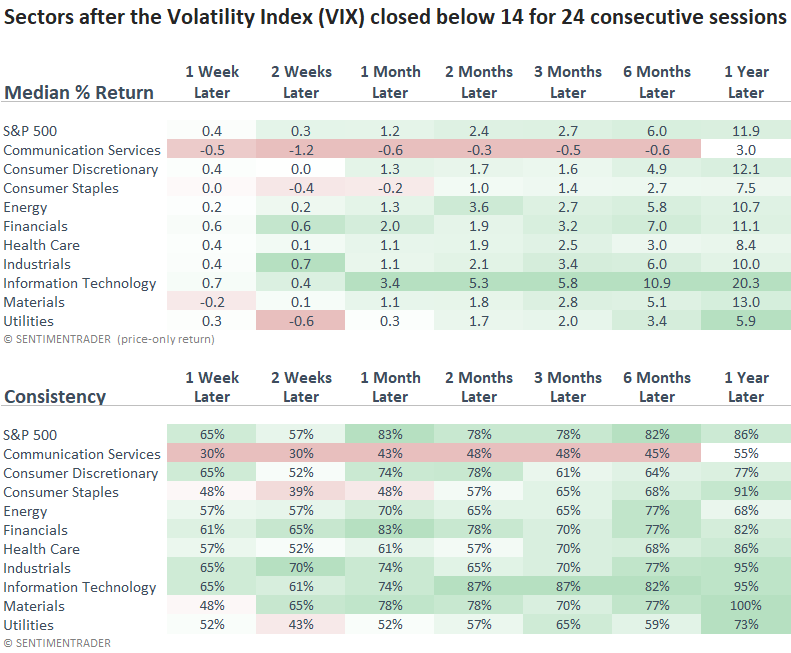
Technology was the clear beneficiary of a low-volatility environment, which aligns with current relative trends. Unsurprisingly, defensive sectors struggled compared to the S&P 500 and cyclical groups.
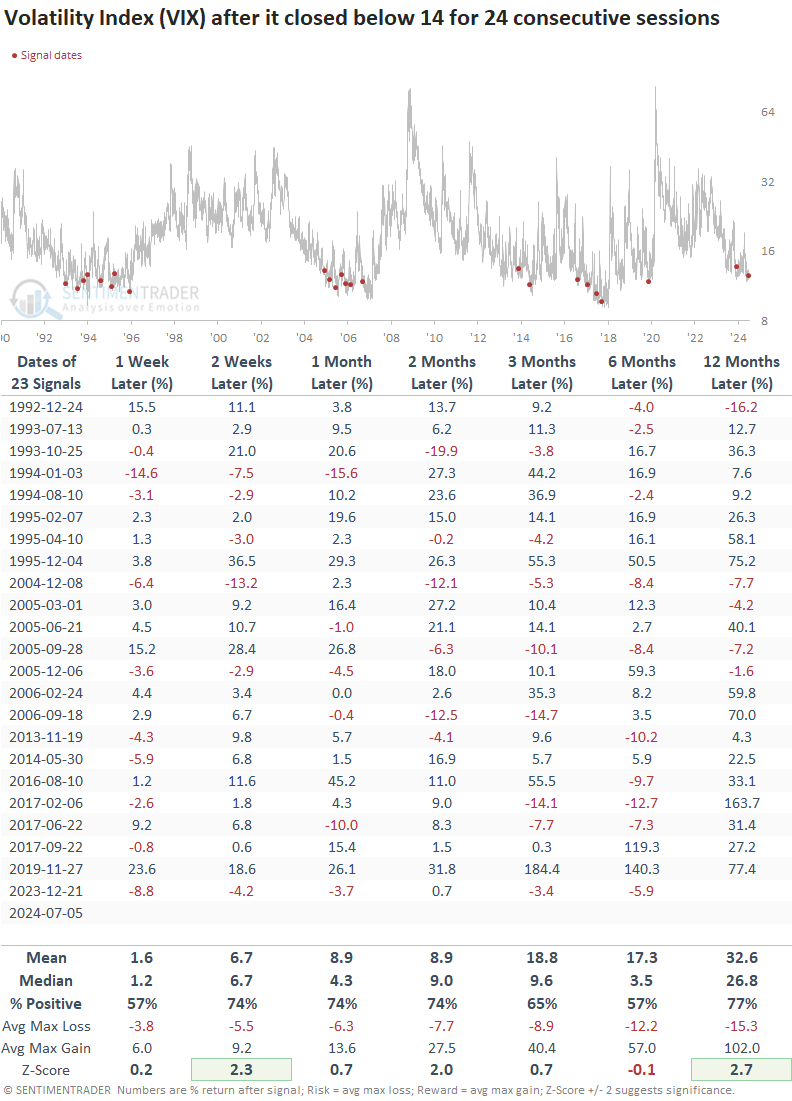
What about volatility?
Suppose I apply the signals to the Volatility Index (VIX). In that case, the index that measures 30-day expected volatility derived from call and put options on the S&P 500 Index showed a consistent upward bias over the subsequent year. This pattern was also observed during low-volatility periods like 1995, 2013, and 2017, which resemble the current backdrop.
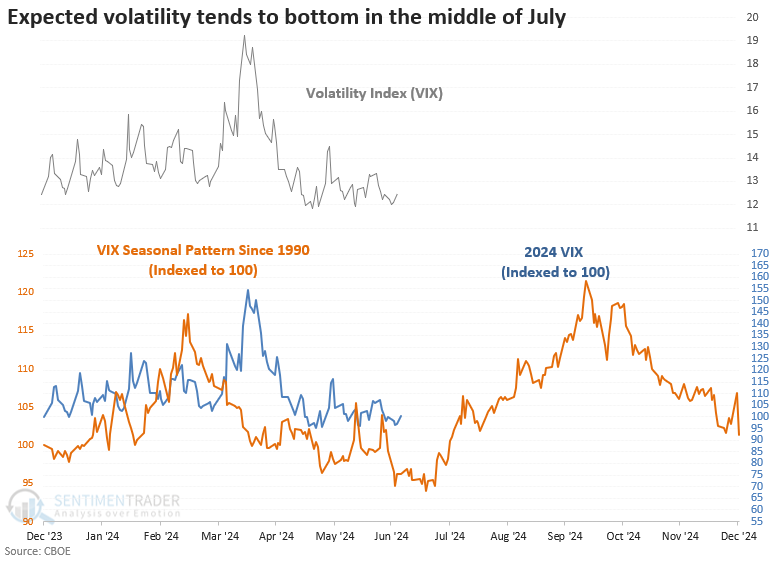
Seasonality suggests that expected volatility could begin to rise
Similar to stocks, the Volatility Index (VIX) follows a seasonal pattern, with expected volatility often hitting a low in mid-July and climbing through early October.
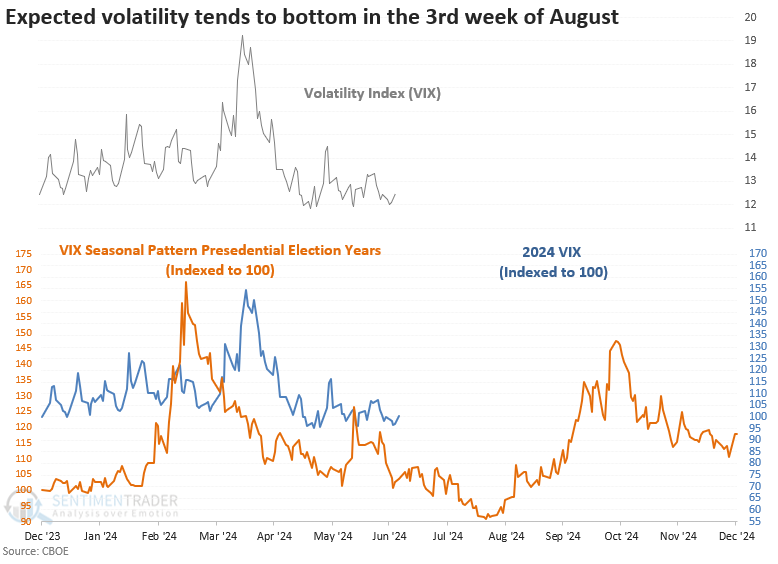
However, during presential election years, the Volatility Index (VIX) tended to bottom in the third week of August and rose until about a week before the election.
What the research tells us...
We've extensively addressed the participation problem plaguing almost every domestic index. While I'm a firm believer that market breadth indicators are one of the best tools for detecting potential trend changes in advance of price alone, a balanced weight-of-the-evidence approach that incorporates other factors is always prudent. With the Volatility Index (VIX) hovering below 14 for an extended period, a scenario typically associated with low volatility uptrends, the S&P 500 looks poised to continue its winning ways. However, nothing goes up in a straight line forever. With an unfavorable seasonal period for the Volatility Index (VIX) approaching ahead of the election, it's likely that expected volatility is near a low point.