Products
SentimenTrader Trading Tools
‍
Backtest Engine
My Trading Toolkit
Correlation Analysis
Seasonality
Market Prediction
Indicators & Data API
‍
Proprietary Indicators & Charts
Market Data API
Strategies & Scanner
‍
50+ Trading Strategies
Smart Stock Scanner
Smart Option Scanner
Research Reports
‍
Research Solutions
Reports Library
Free Resources
Simple Backtest Calculator
Simple Seasonality Calculator
The Kelly Criterion Calculator
Sentiment Geo Map
Public Research Reports
Education
Sentiment Indicators
Technical Indicators
Pricing
Company
About
In the News
Testimonials
Client Success Stories
Contact
Log inLoginSign up
< BACK TO ALL REPORTS

A persistent uptrend in Gold suggests more upside

Dean Christians
2024-10-22
For only the 9th time since 1971, Gold closed above its 200-day average for 260 consecutive sessions, indicating persistent upside price momentum. Following similar precedents, the precious metal rallied 100% of the time over the subsequent six and twelve months.

Key points:

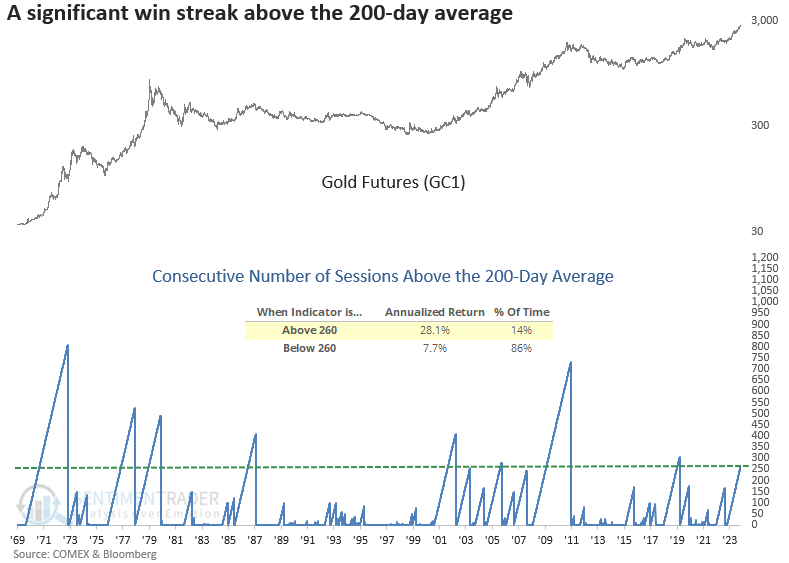
  • Gold has now closed above its 200-day average for 260 consecutive sessions
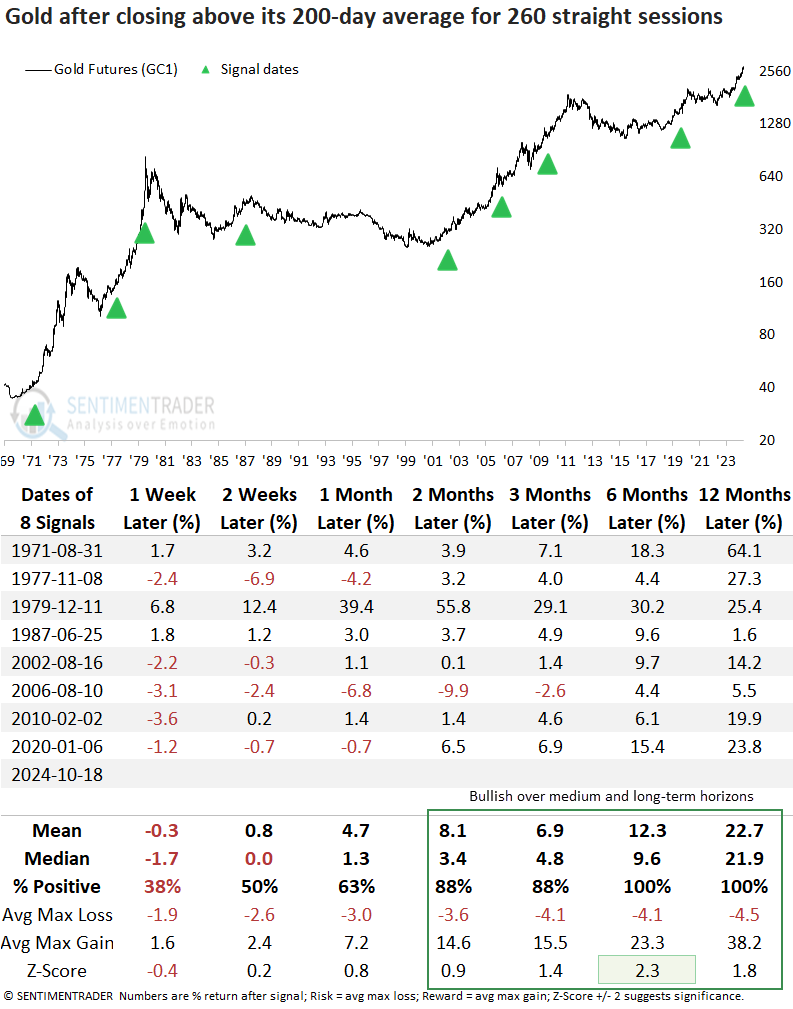
  • Similar win streaks saw Gold futures rise 100% of the time over six and twelve months
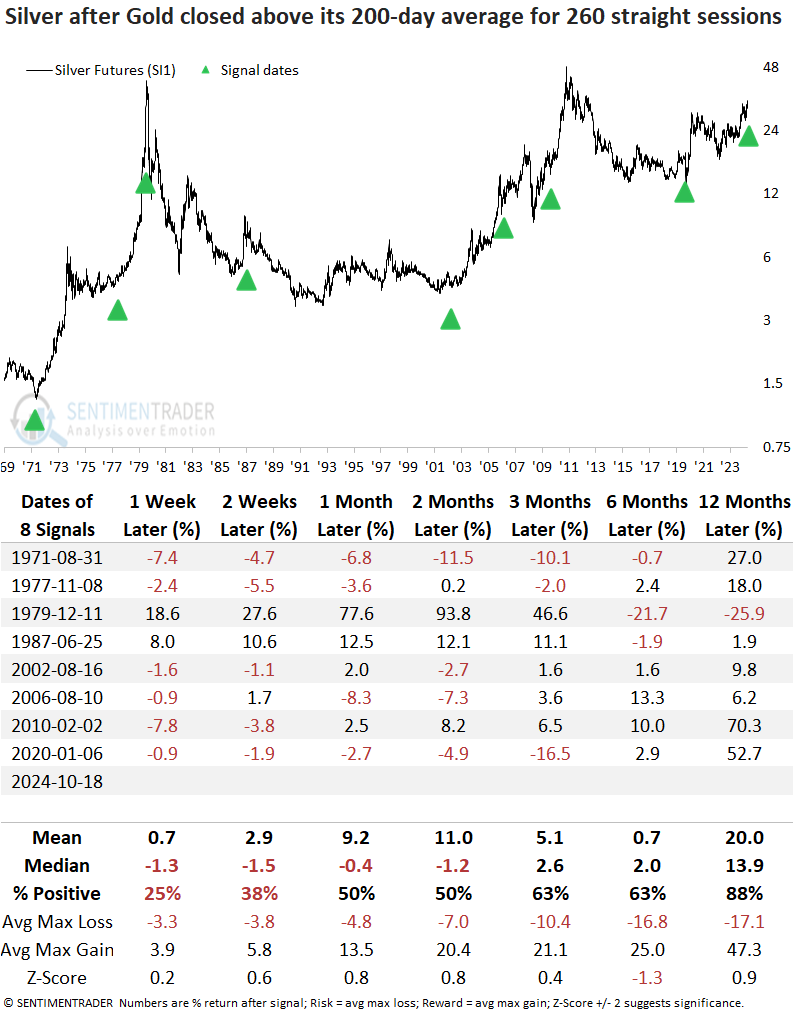
  • A year later, Gold miners rallied 100% of the time, and Silver rallied 88% of the time

The case for a sustained uptrend in Gold gains further credence

Jason recently published a report highlighting that Gold had closed at a new high 37 times over a rolling one-year period. The conclusion was that the precious metal had more upside potential, rising 89% of the time a year later.

Although we'll only know in hindsight whether Gold is in a secular or cyclical uptrend, the case for a sustained advance gained further credence now that the precious metal closed above its 200-day moving average for 260 consecutive sessions. 

The previous signal occurred in January 2020, and Gold rallied 23.8% over the subsequent year. Furthermore, when the successive number of days above the 200-day average exceeds a count of 260, the precious metal displayed an annualized return of 28.1%. 

Comparable win streaks preceded additional upside for gold

While the sample size is small, whenever Gold futures closed above its 200-day average for 260 straight sessions, the precious metal rose 100% of the time over the ensuing six and twelve months. Additionally, the six-month horizon showed significance relative to random returns.

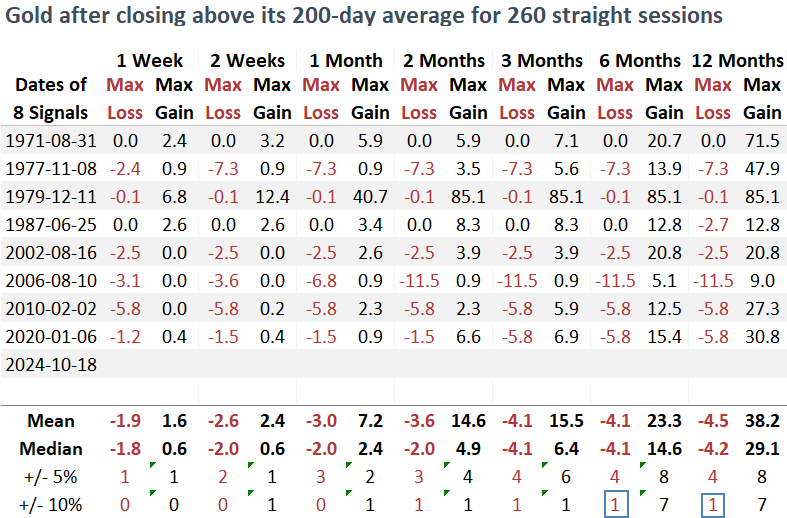
Over the subsequent six and twelve months, Gold futures experienced just one instance of a maximum loss exceeding -10%. 

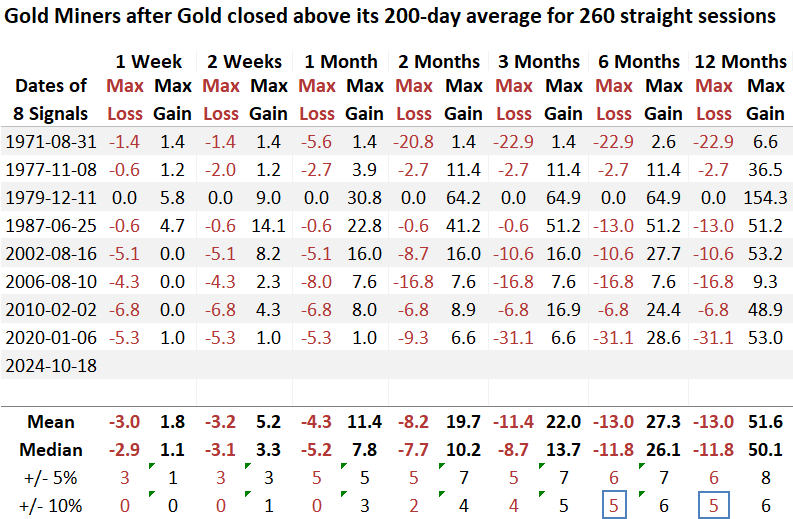
The Gold BUGS Index (HUI) tended to follow the precious metals lead, rallying 100% of the time over the subsequent twelve months. Additionally, both the six and twelve-month horizons almost displayed significance. 

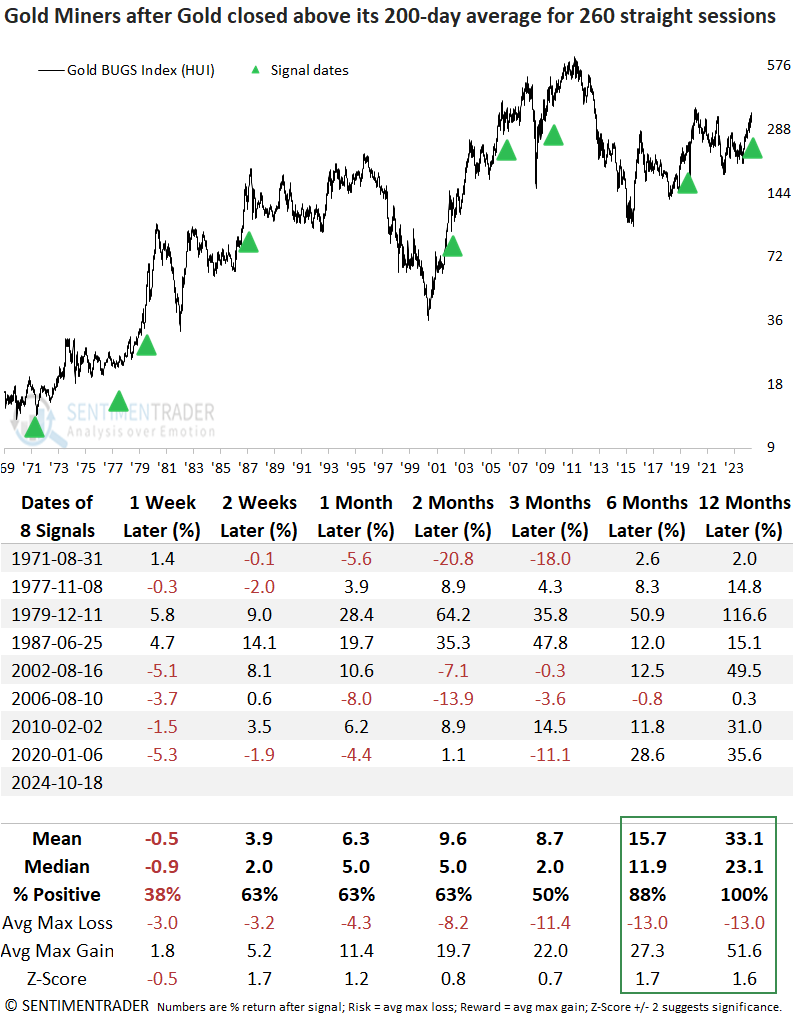
If you hold a position in gold miners or are thinking about one, remember that the upward trajectory could be volatile despite a bullish outlook. In the six- and twelve-month windows, maximum losses of over -10% occurred in 5 out of 8 cases 

How does Silver perform?

When Gold displays a persistent uptrend like now, Silver tends to tag along, rallying 88% of the time over the following year. However, like gold miners, the path to higher prices was volatile. 

What about stocks?

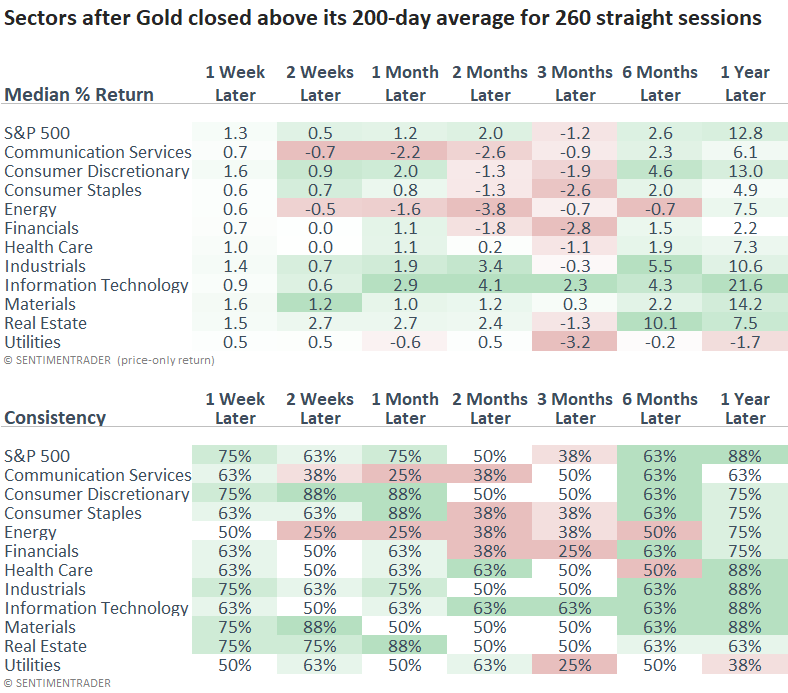
The S&P 500 and most sectors displayed a negative outlook over the next three months, potentially suggesting some macro factor influenced Gold, which heightened concerns among stock investors. However, a year later, the world's most benchmarked index rose 88% of the time. 

What the research tells us...

Gold has now closed above its 200-day moving average for an impressive 260 consecutive days, a persistent trend that strongly indicates the rally in the precious metal is likely to sustain itself over the coming year. Historically, after such periods of extended strength, gold has been higher 100% of the time at both six and twelve-month intervals, suggesting bullish momentum. In this environment, gold miners and silver have also rallied, benefiting from the broader rise in precious metals. Interestingly, while the S&P 500 and its sectors struggled over the medium-term horizon during these periods, they often managed to stage a recovery and rally over longer-term horizons.

PRODUCTS
SentimenTrader
Trading Tools
Indicators & Data API
‍
Strategies & Scanner
‍
Research Reports
FREE
RESOUrCES
Simple Backtest
Calculator
Simple Seasonality
Calculator
The Kelly Criterion
Calculator
Sentiment Geo Map
‍
Public Research Reports
‍
Education
Sentiment Indicators
‍
Technical Indicators
‍
Pricing
Bundle pricing
‍
FAQ
‍
Announcements
‍
COMPANY
‍
About
‍
In the News
‍
Testimonials
‍
Client Success Stories
CONTACT
‍
General Inquiries
‍
Media Inquiries
‍
Financial Professionals Inquiries
‍
© 2026 Sundial Capital Research Inc. All rights reserved.
Setsail Marketing
TermsPrivacyAffiliate Program
Risk Disclosure: The information and tools provided are for research and analytical purposes only and are not intended as investment advice. Market analysis involves uncertainty, and outcomes may differ from expectations. Users should conduct their own due diligence and consider their individual circumstances before making any financial decisions. Past performance is not necessarily indicative of future results.

Hypothetical Performance Disclosure: Hypothetical performance results have many inherent limitations, some of which are described below. No representation is being made that any account will or is likely to achieve profits or losses similar to those shown; in fact, there are frequently sharp differences between hypothetical performance results and the actual results subsequently achieved by any particular trading program. One of the limitations of hypothetical performance results is that they are generally prepared with the benefit of hindsight. In addition, hypothetical trading does not involve financial risk, and no hypothetical trading record can completely account for the impact of financial risk of actual trading. for example, the ability to withstand losses or to adhere to a particular trading program in spite of trading losses are material points which can also adversely affect actual trading results. There are numerous other factors related to the markets in general or to the implementation of any specific trading program which cannot be fully accounted for in the preparation of hypothetical performance results and all which can adversely affect trading results.

Testimonial Disclosure: Testimonials appearing on this website may not be representative of other clients or customers and is not a guarantee of future performance or success.