
A noticeable uptick in thrust signals

Key points:
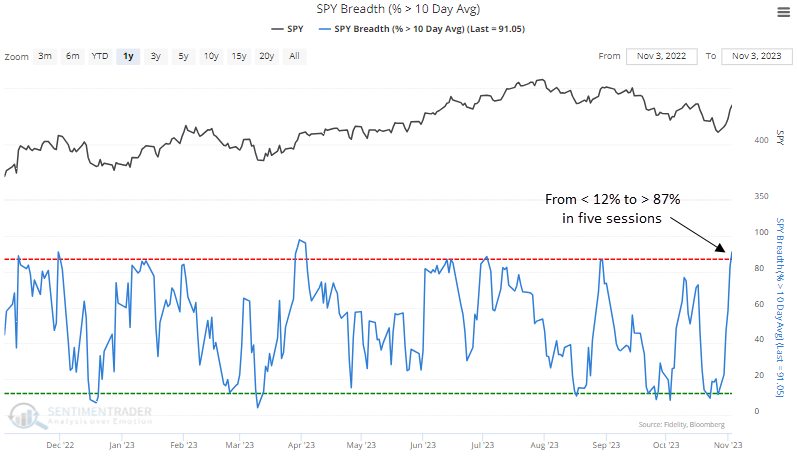
- S&P 500 members trading above their 10-day average cycled from less than 12% to greater than 87%
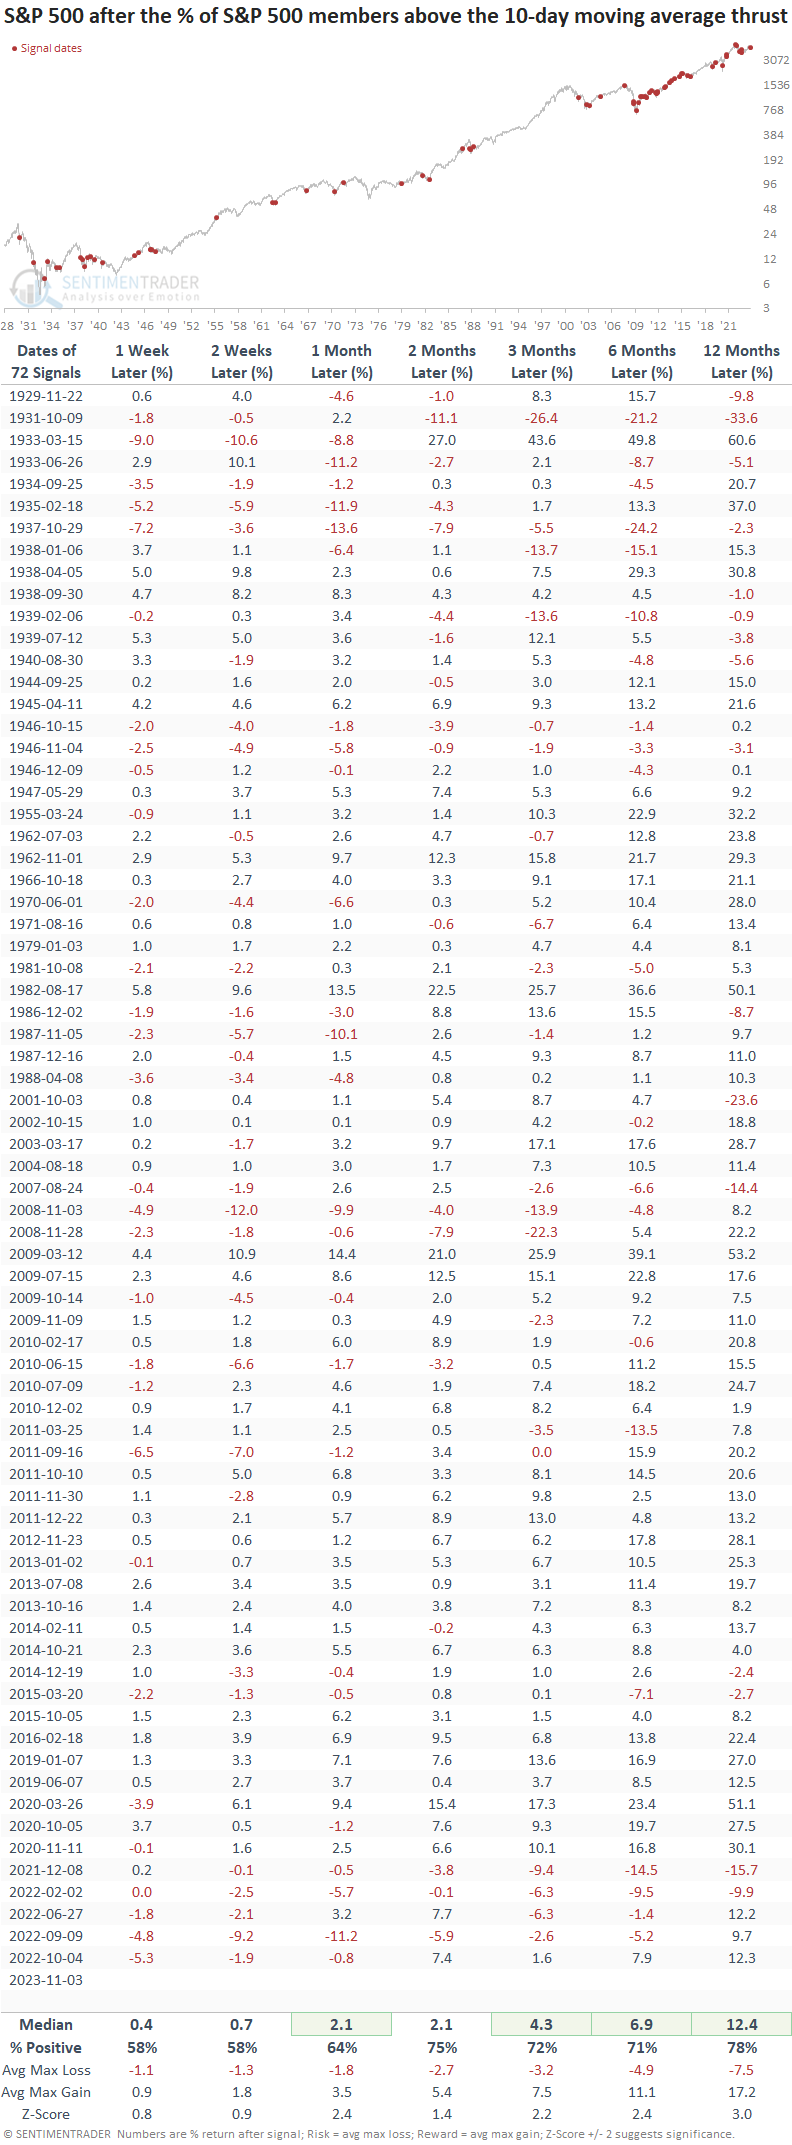
- Similar oversold to overbought reversals led to further upside for the S&P 500 over the subsequent months
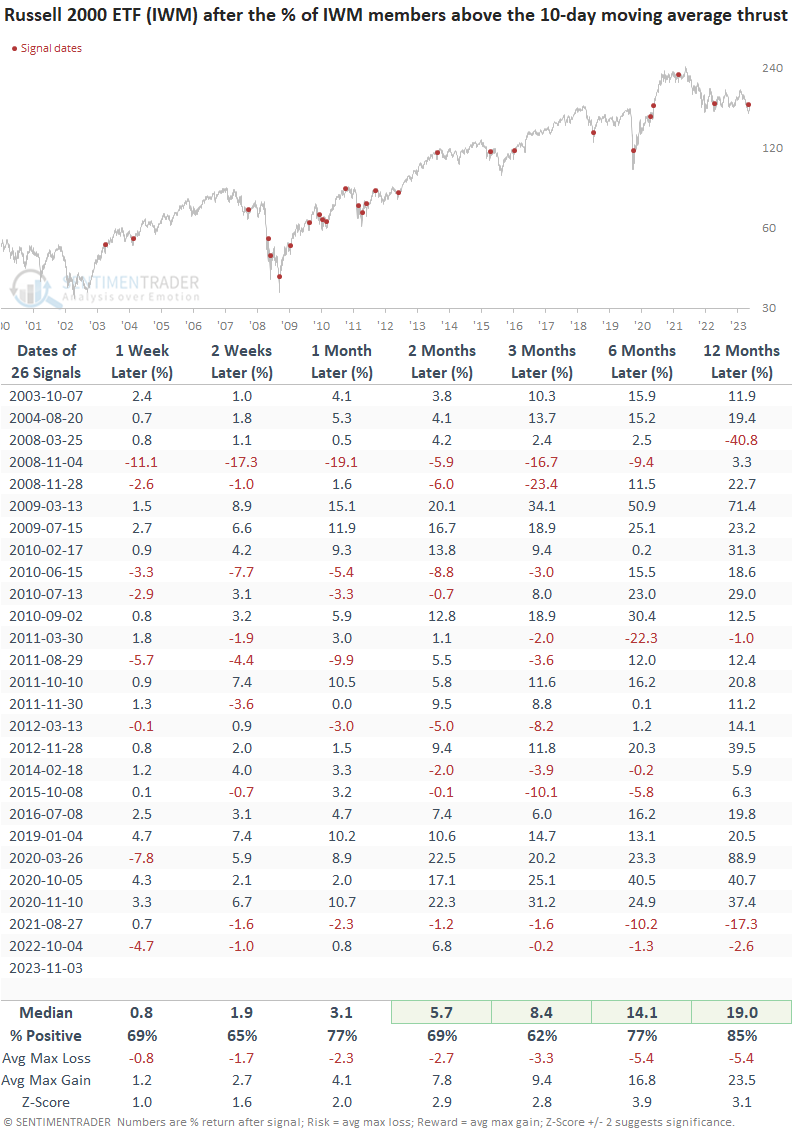
- Russell 2000 stocks above their 10-day average also reversed, triggering a bullish buy signal
- When the S&P 500 increases for five straight sessions from a five-month low, the momentum continues
The prevalence of short-duration thrust signals is increasing
The S&P 500 and several other indexes experienced sharp reversals last week after registering multi-month lows and, in some cases, annual lows.
The reversal from oversold to overbought conditions triggered several short-duration thrust signals across indexes containing small, medium, and large capitalization stocks, a phenomenon not seen since the lows in October 2022.
One of the thrust signals, a voting member in the TCTM Composite Thrust Model, issued an alert at the close of trading on Friday. The system identifies when the percentage of S&P 500 members above their 10-day moving average cycled from less than 12% to greater than 87% in nine or fewer sessions.
Similar oversold to overbought thrust signals preceded positive returns
Whenever, in a span of nine or fewer trading sessions, the percentage of S&P 500 members trading above their 10-day average shifts from below 12% to above 87%, there's a solid tendency that the bullish price momentum in the world's most benchmarked index will continue.
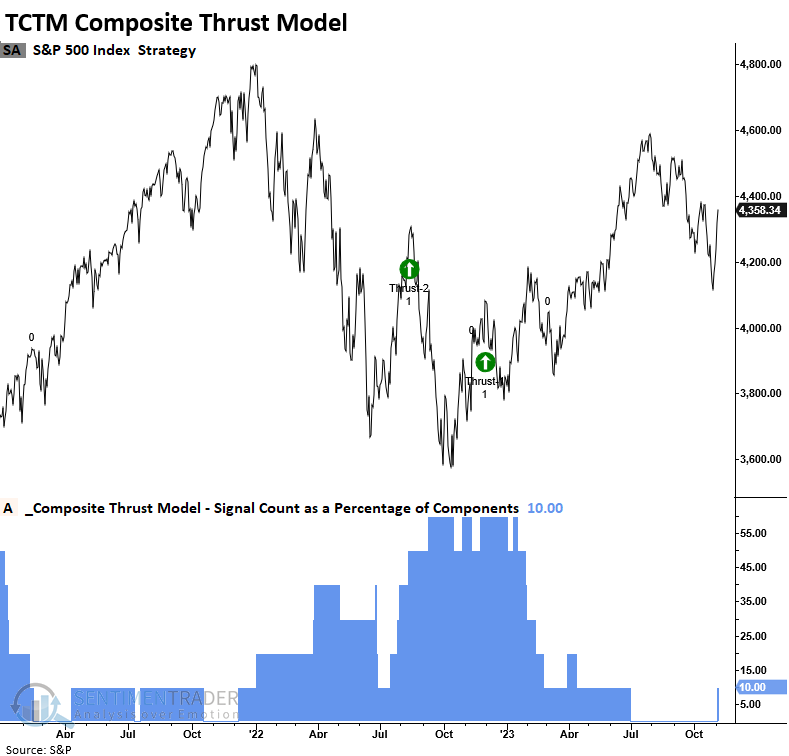
Past bear market precedents, including 2022 and the 1930s, have demonstrated their share of difficulties. In light of this, it is advisable to adopt a weight-of-the-evidence approach that combines short and medium-term indicator lengths, a principle applied to the TCTM Composite Thrust Model.
Weight of the evidence approach
The TCTM Composite Thrust Model utilizes a blend of short and medium-term breadth-based indicators to pinpoint crucial turning points in the S&P 500. Following the latest alert, the composite count has risen to 10%. Model signals trigger once the count reaches 50%. Keep an eye out for updates.
A potential turning point for small-cap stocks?
Small-cap stocks, which have struggled in a prolonged downtrend, recently saw their first oversold to overbought thrust signal since the October 2022 low.
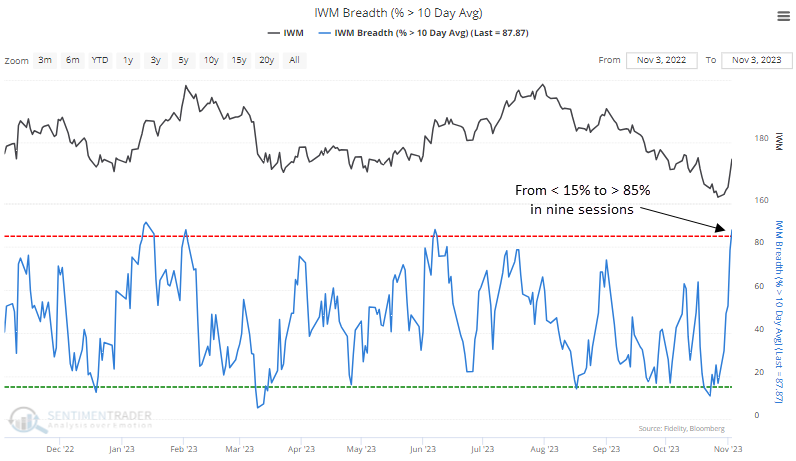
Should the percentage of Russell 2000 stocks trading above their 10-day average shift from less than 15% to greater than 85% in as little as ten trading sessions, it strongly suggests that the bullish price momentum in small-cap stocks will persist.
Although small-cap stocks don't necessarily need to outperform in a cyclical uptrend, it's always more advantageous to see widespread participation across various market capitalizations rather than a lack of it.
Bullish price action at the index level
After reaching a five-month low on October 27th, the S&P 500 experienced a resurgence, climbing for five consecutive sessions last week. The previous instance occurred over 14 years ago, in July 2010.
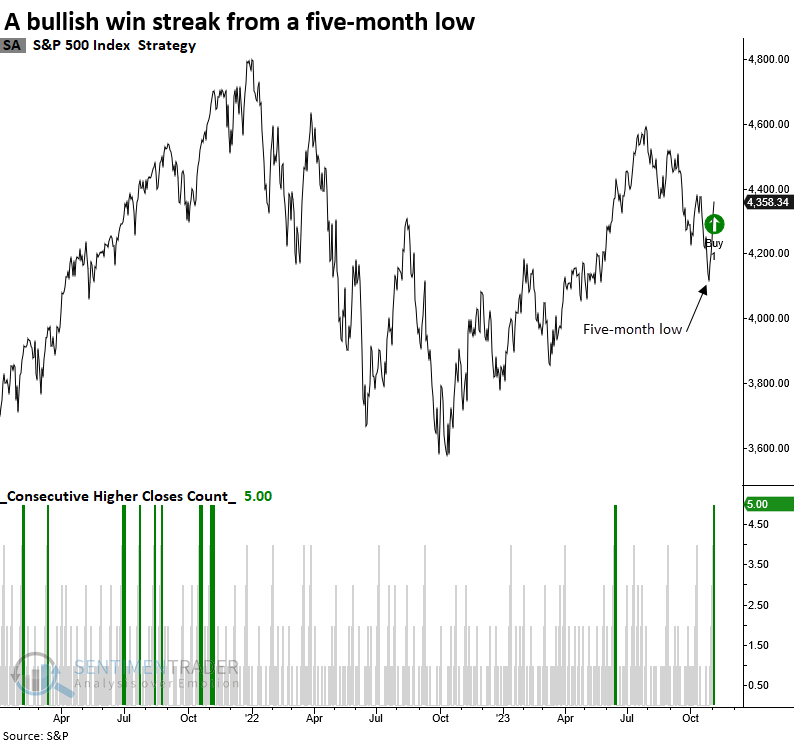
A pause that refreshes the bullish momentum
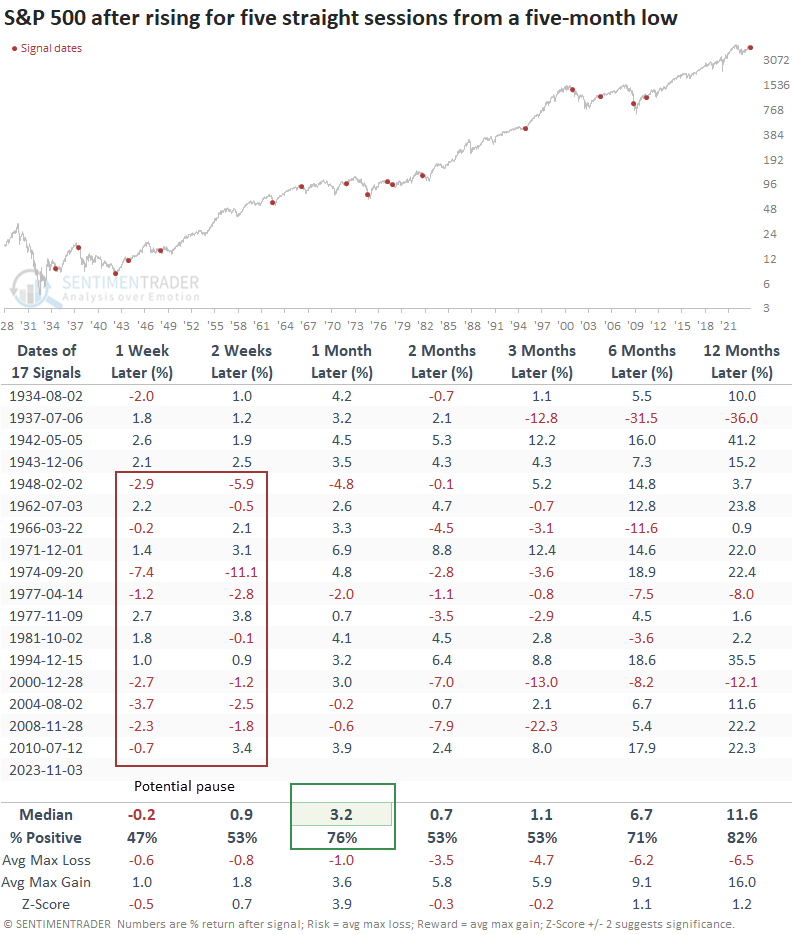
When the S&P 500 increases for five straight sessions from a five-month low, the large-cap index tends to pause over the following few weeks. That was especially the case since 1948, with 10 out of 13 precedents showing a negative return at some point over that time frame. A month later, the S&P 500 was higher 76% of the time, with a median gain of 3.2%.
With several gap-up openings over the last five sessions, it wouldn't be surprising to see at least the last one filled based on this outlook table.
What the research tells us...
Short-duration price and market breadth indicators witnessed sharp reversals from oversold territory, generating several thrust signals with bullish implications. While a short-term pause after last week's advance would not be surprising, the evidence is building in favor of a year-end rally. As always, when markets turn up from an oversold condition, we want to identify leading stocks in the strongest sectors and industries.