Products
SentimenTrader Trading Tools
‍
Backtest Engine
My Trading Toolkit
Correlation Analysis
Seasonality
Market Prediction
Indicators & Data API
‍
Proprietary Indicators & Charts
Market Data API
Strategies & Scanner
‍
50+ Trading Strategies
Smart Stock Scanner
Smart Option Scanner
Research Reports
‍
Research Solutions
Reports Library
Free Resources
Simple Backtest Calculator
Simple Seasonality Calculator
The Kelly Criterion Calculator
Sentiment Geo Map
Public Research Reports
Education
Sentiment Indicators
Technical Indicators
Pricing
Company
About
In the News
Testimonials
Client Success Stories
Contact
Log inLoginSign up
< BACK TO ALL REPORTS

A notable breakout in a manufacturing prices paid index

Dean Christians
2025-02-20
The Philly Fed Prices Paid Index climbed to its highest level in over two years, pointing to a reflation impulse from the manufacturing sector. Similar breakouts near a high produced robust S&P 500 performance over the next year.

Key points:

  • The Philly Fed prices paid index increased to the highest level in over two years 
  • Similar breakouts in a survey for manufacturing prices paid preceded a bullish outlook for stocks
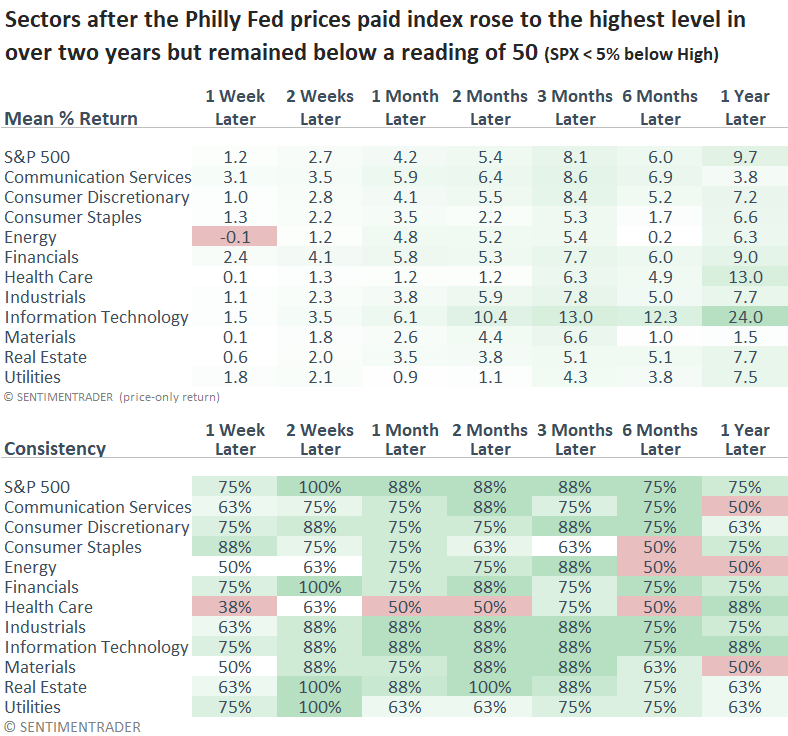
  • Technology outperformed all other sectors over the subsequent year

Should we worry about a breakout in manufacturing prices paid? 

The Federal Reserve Bank of Philadelphia released its manufacturing survey today. Although the overall measure edged down, the prices paid component surged by 9 points, surpassing the highest level in over two years. However, it remained below a reading of 50, a critical piece of context.

As expected, the price-paid index breakout ignited a fresh round of inflation fears across social media and financial news networks, most likely due to recency bias from the 2021-22 surge in inflation. 

History indicates this fear is unwarranted for now, as S&P 500 returns slow considerably once the index surpasses 50 and turns negative beyond 60, as illustrated in the chart below.

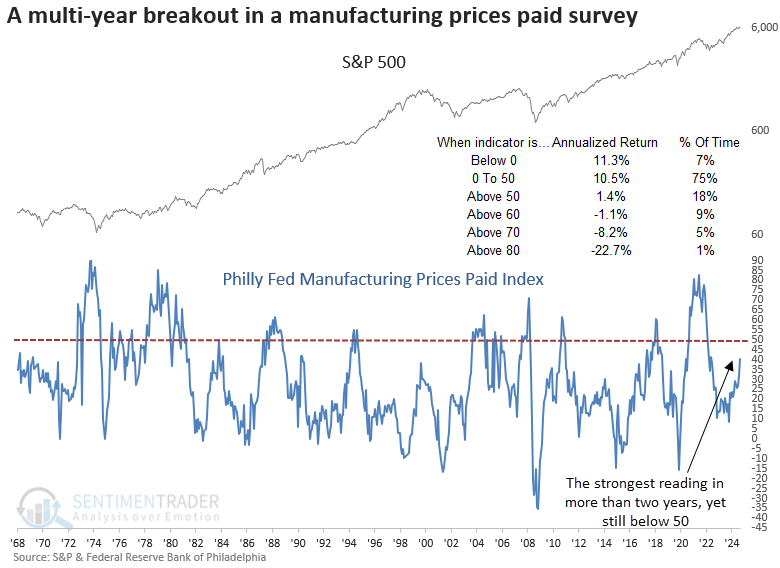
Signal dates were adjusted to align with the third Thursday of the month, coinciding with the data release. Although not a primary stock market signal, survey-based economic data can serve as a historical reference, offering valuable insight into the business cycle and its influence on stock prices.  

Similar breakouts in a prices-paid index preceded positive returns for stocks

A breakout in the Philly Fed prices paid manufacturing index, coinciding with the S&P 500 trading near its all-time high, produced excellent returns and consistency for the world's most benchmarked index over the subsequent year, suggesting a reflationary tailwind that supported, rather than hindered, stocks. 

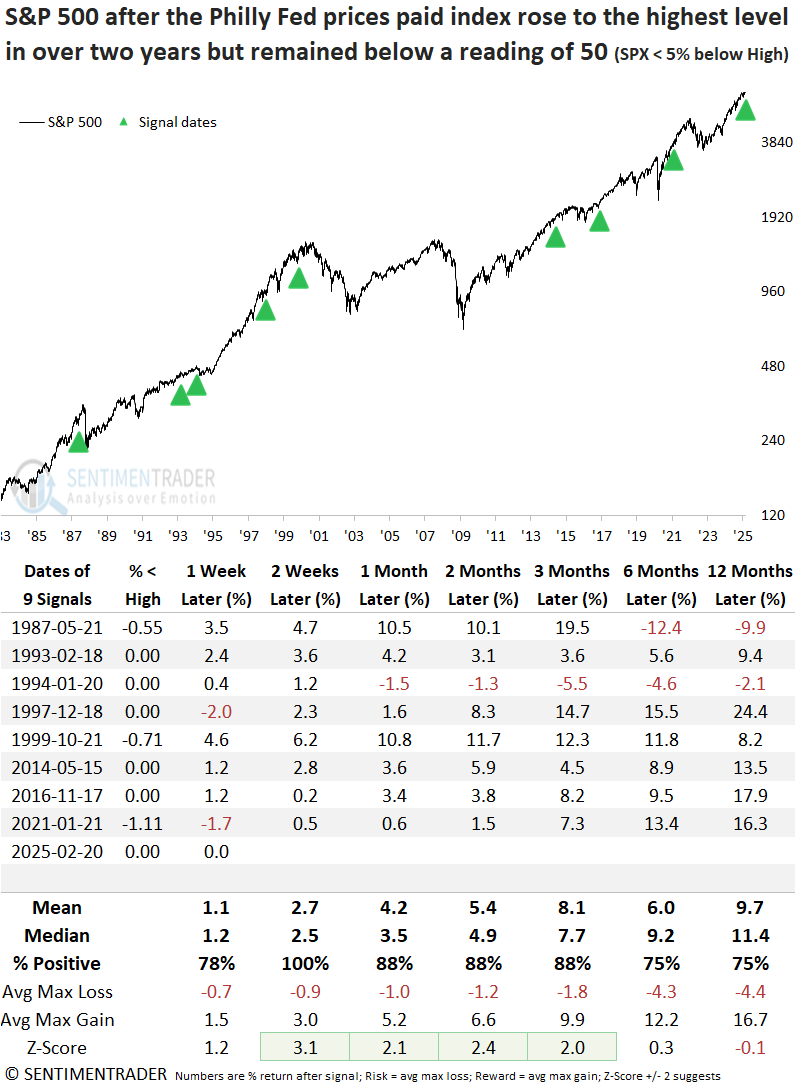
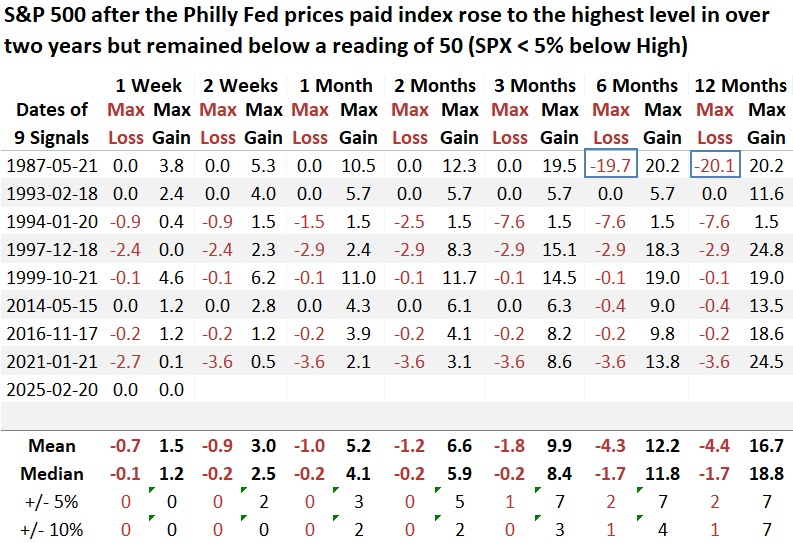
Over the subsequent twelve months, the S&P 500 experienced only one maximum loss that surpassed -10%, an anomaly associated with the 1987 crash.  

The Technology sector was the clear winner following a breakout in the prices paid index, gaining 88% of the time over the next year with a median return of 24%. Even excluding Dotcom-era signals from 1997 and 1999, it remained the top-performing sector. 
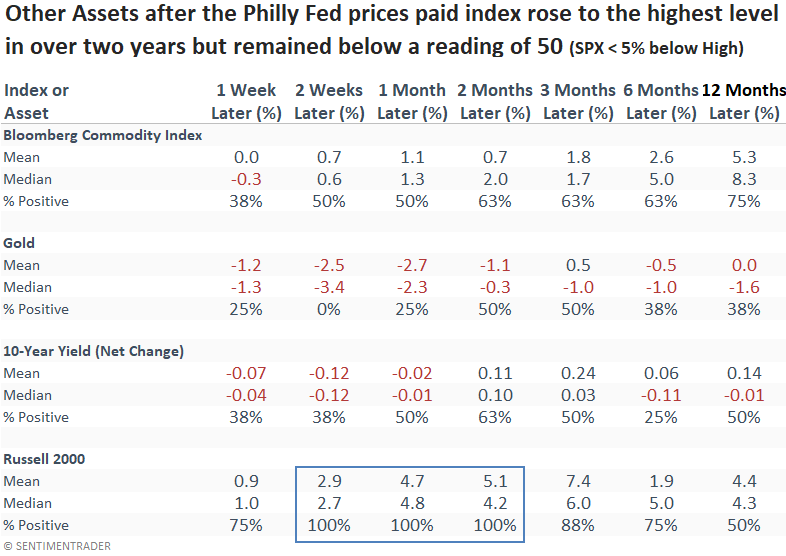
Other assets

Despite a breakout in the prices paid index signaling reflation, there was no substantial rally in commodities or gold, and the 10-year Treasury yield mostly trended lower. The small-cap Russell 2000 showed robust short- and medium-term performance, but consistency was a coin toss over the subsequent year. 

What the research tells us...

The Philly Fed Prices Paid Index climbed to its highest level in over two years. Yet, it remained below the critical 50 threshold, signaling that while there are signs of rising inflationary pressures, the situation is not yet severe enough to disrupt stock prices. Historically, similar breakouts have been followed by impressive returns and consistency for the S&P 500 over the following year. Notably, the Technology sector has led the charge, outperforming all other groups. 

PRODUCTS
SentimenTrader
Trading Tools
Indicators & Data API
‍
Strategies & Scanner
‍
Research Reports
FREE
RESOUrCES
Simple Backtest
Calculator
Simple Seasonality
Calculator
The Kelly Criterion
Calculator
Sentiment Geo Map
‍
Public Research Reports
‍
Education
Sentiment Indicators
‍
Technical Indicators
‍
Pricing
Bundle pricing
‍
FAQ
‍
Announcements
‍
COMPANY
‍
About
‍
In the News
‍
Testimonials
‍
Client Success Stories
CONTACT
‍
General Inquiries
‍
Media Inquiries
‍
Financial Professionals Inquiries
‍
© 2026 Sundial Capital Research Inc. All rights reserved.
Setsail Marketing
TermsPrivacyAffiliate Program
Risk Disclosure: The information and tools provided are for research and analytical purposes only and are not intended as investment advice. Market analysis involves uncertainty, and outcomes may differ from expectations. Users should conduct their own due diligence and consider their individual circumstances before making any financial decisions. Past performance is not necessarily indicative of future results.

Hypothetical Performance Disclosure: Hypothetical performance results have many inherent limitations, some of which are described below. No representation is being made that any account will or is likely to achieve profits or losses similar to those shown; in fact, there are frequently sharp differences between hypothetical performance results and the actual results subsequently achieved by any particular trading program. One of the limitations of hypothetical performance results is that they are generally prepared with the benefit of hindsight. In addition, hypothetical trading does not involve financial risk, and no hypothetical trading record can completely account for the impact of financial risk of actual trading. for example, the ability to withstand losses or to adhere to a particular trading program in spite of trading losses are material points which can also adversely affect actual trading results. There are numerous other factors related to the markets in general or to the implementation of any specific trading program which cannot be fully accounted for in the preparation of hypothetical performance results and all which can adversely affect trading results.

Testimonial Disclosure: Testimonials appearing on this website may not be representative of other clients or customers and is not a guarantee of future performance or success.