A New Low for the Volatility Index

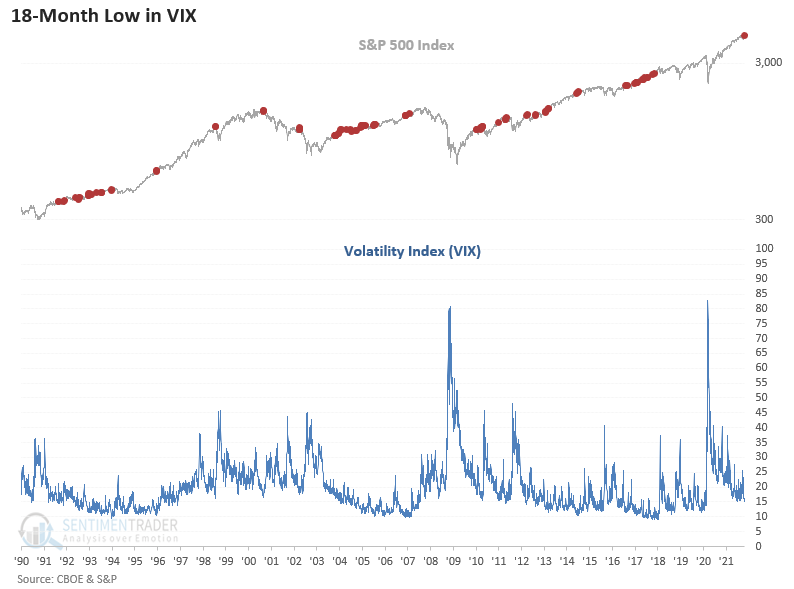
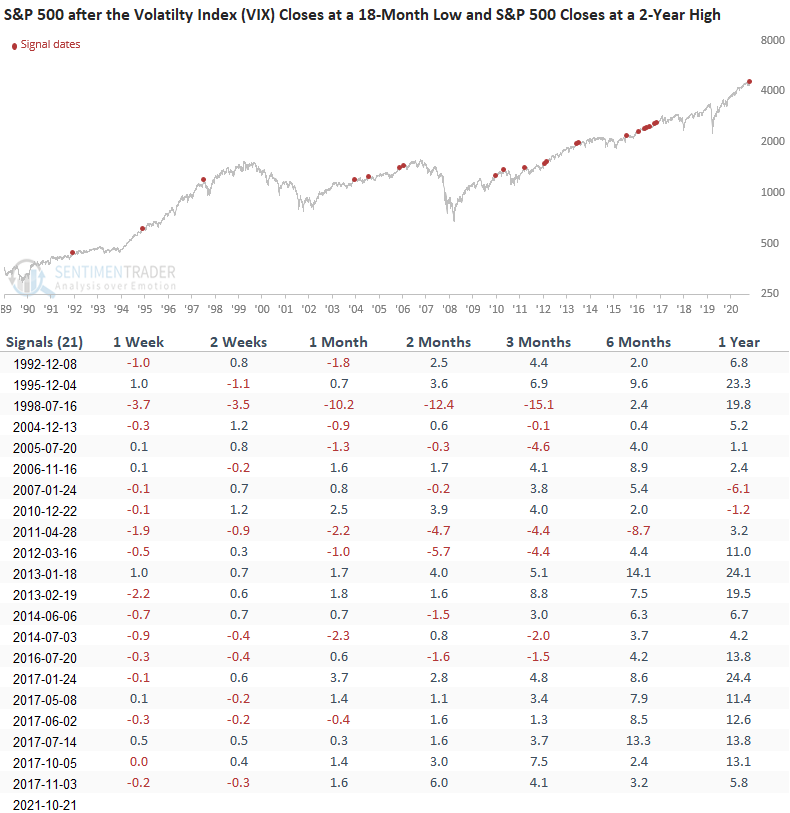
The Volatility Index (VIX) closed at a new 18-month low as the S&P 500 closed at a new multi-year high on Thursday, 10/21/21. If you were wondering, the 18-month low in the VIX Index represents the first occurrence since November 2017.
With volatility at the lowest point in 18 months, should we be concerned?
Let's conduct a study to assess the outlook for the S&P 500 when the VIX Index registers a new 378-day low and the S&P 500 simultaneously closes at a 504 day high.
Please note I convert months and years to daily values for studies. i.e., 18-months is equivalent to 378 trading days.
HISTORICAL CHART
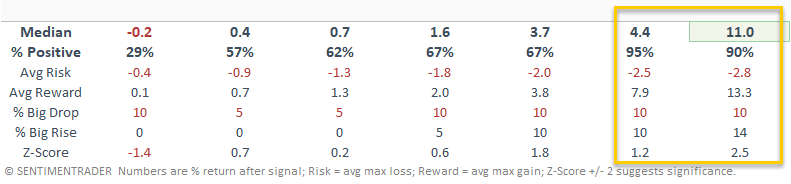
HOW THE SIGNALS PERFORMED
The one-week results look underwhelming. I suspect the market takes a breather after the new low in volatility. However, I would not let the low volatility regime alter your outlook for the bull market. The intermediate to long-term results are good, especially the 6-12 month time frame.