Data &
Technology
Research
Reports
Report Solutions
Reports Library
Actionable
Strategies
Free
Resources
Simple Backtest Calculator
Simple Seasonality Calculator
The Kelly Criterion Calculator
Sentiment Geo Map
Public Research Reports
Free Webinar
Pricing
Company
About
Meet Our Team
In the News
Testimonials
Client Success Stories
Contact
Log inLoginSign up
< BACK TO ALL REPORTS

A New Growth vs. Value Signal

Dean Christians
2021-06-24
A new relative ratio range rank signal for growth stocks triggered on the close of trading on 6/22/21. Let's review the concept and forward return outlook.

A new relative ratio range rank signal for growth stocks triggered on the close of trading on 6/22/21. Value has been in favor since September of 2020. Could the tide be shifting in favor of growth, or does this signal represent a mean reversion trade that we should rent for the time being?

RELATIVE RATIO RANGE SIGNAL CONCEPT

The concept I use to identify relative ratio range signals is simple. I calculate the ratio for two securities and measure the range over a lookback period in percentage terms. The range rank methodology allows one to test threshold levels between 0 and 100%. I then optimized the signal to determine the most favorable lookback period, reset and buy level thresholds.

PARAMETERS AND CONDITIONS FOR GROWTH SIGNALS

Ratio = Growth Index/Value Index. The range rank for the relative ratio utilizes an 84-day lookback period. 

  1. If the relative ratio range rank crosses below the 10th percentile, the reset condition is true.
  2. If the reset condition is true and the relative ratio range rank crosses above the 93rd percentile, buy the growth index.

Let's take a look at the current chart and historical signal performance.
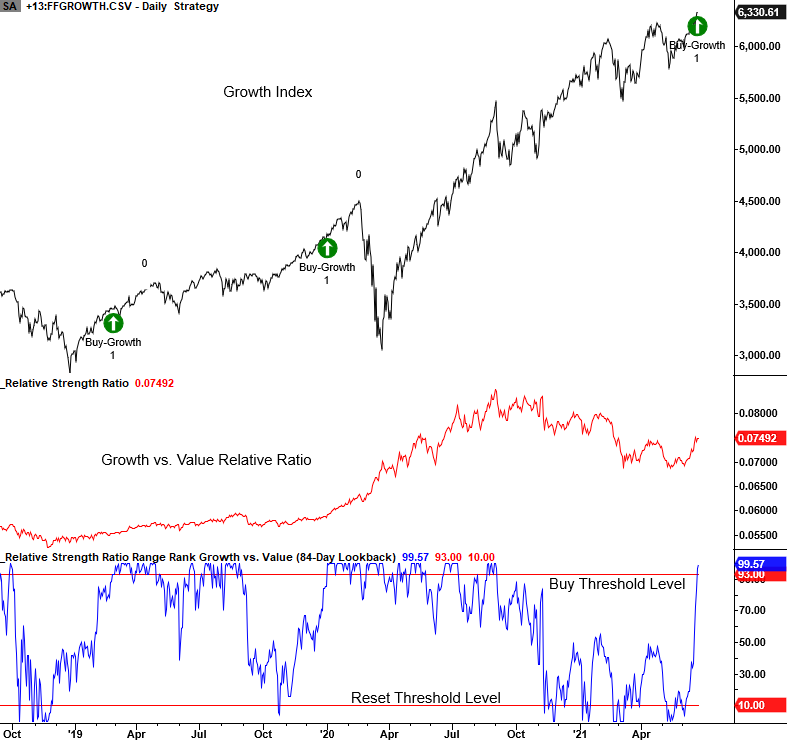
CURRENT DAY CHART

The relative ratio range for growth vs. value reset below the 10th percentile last November, and value has been in favor for almost seven months. The range rank exploded higher this week and triggered a new signal that suggests we should favor growth stocks.

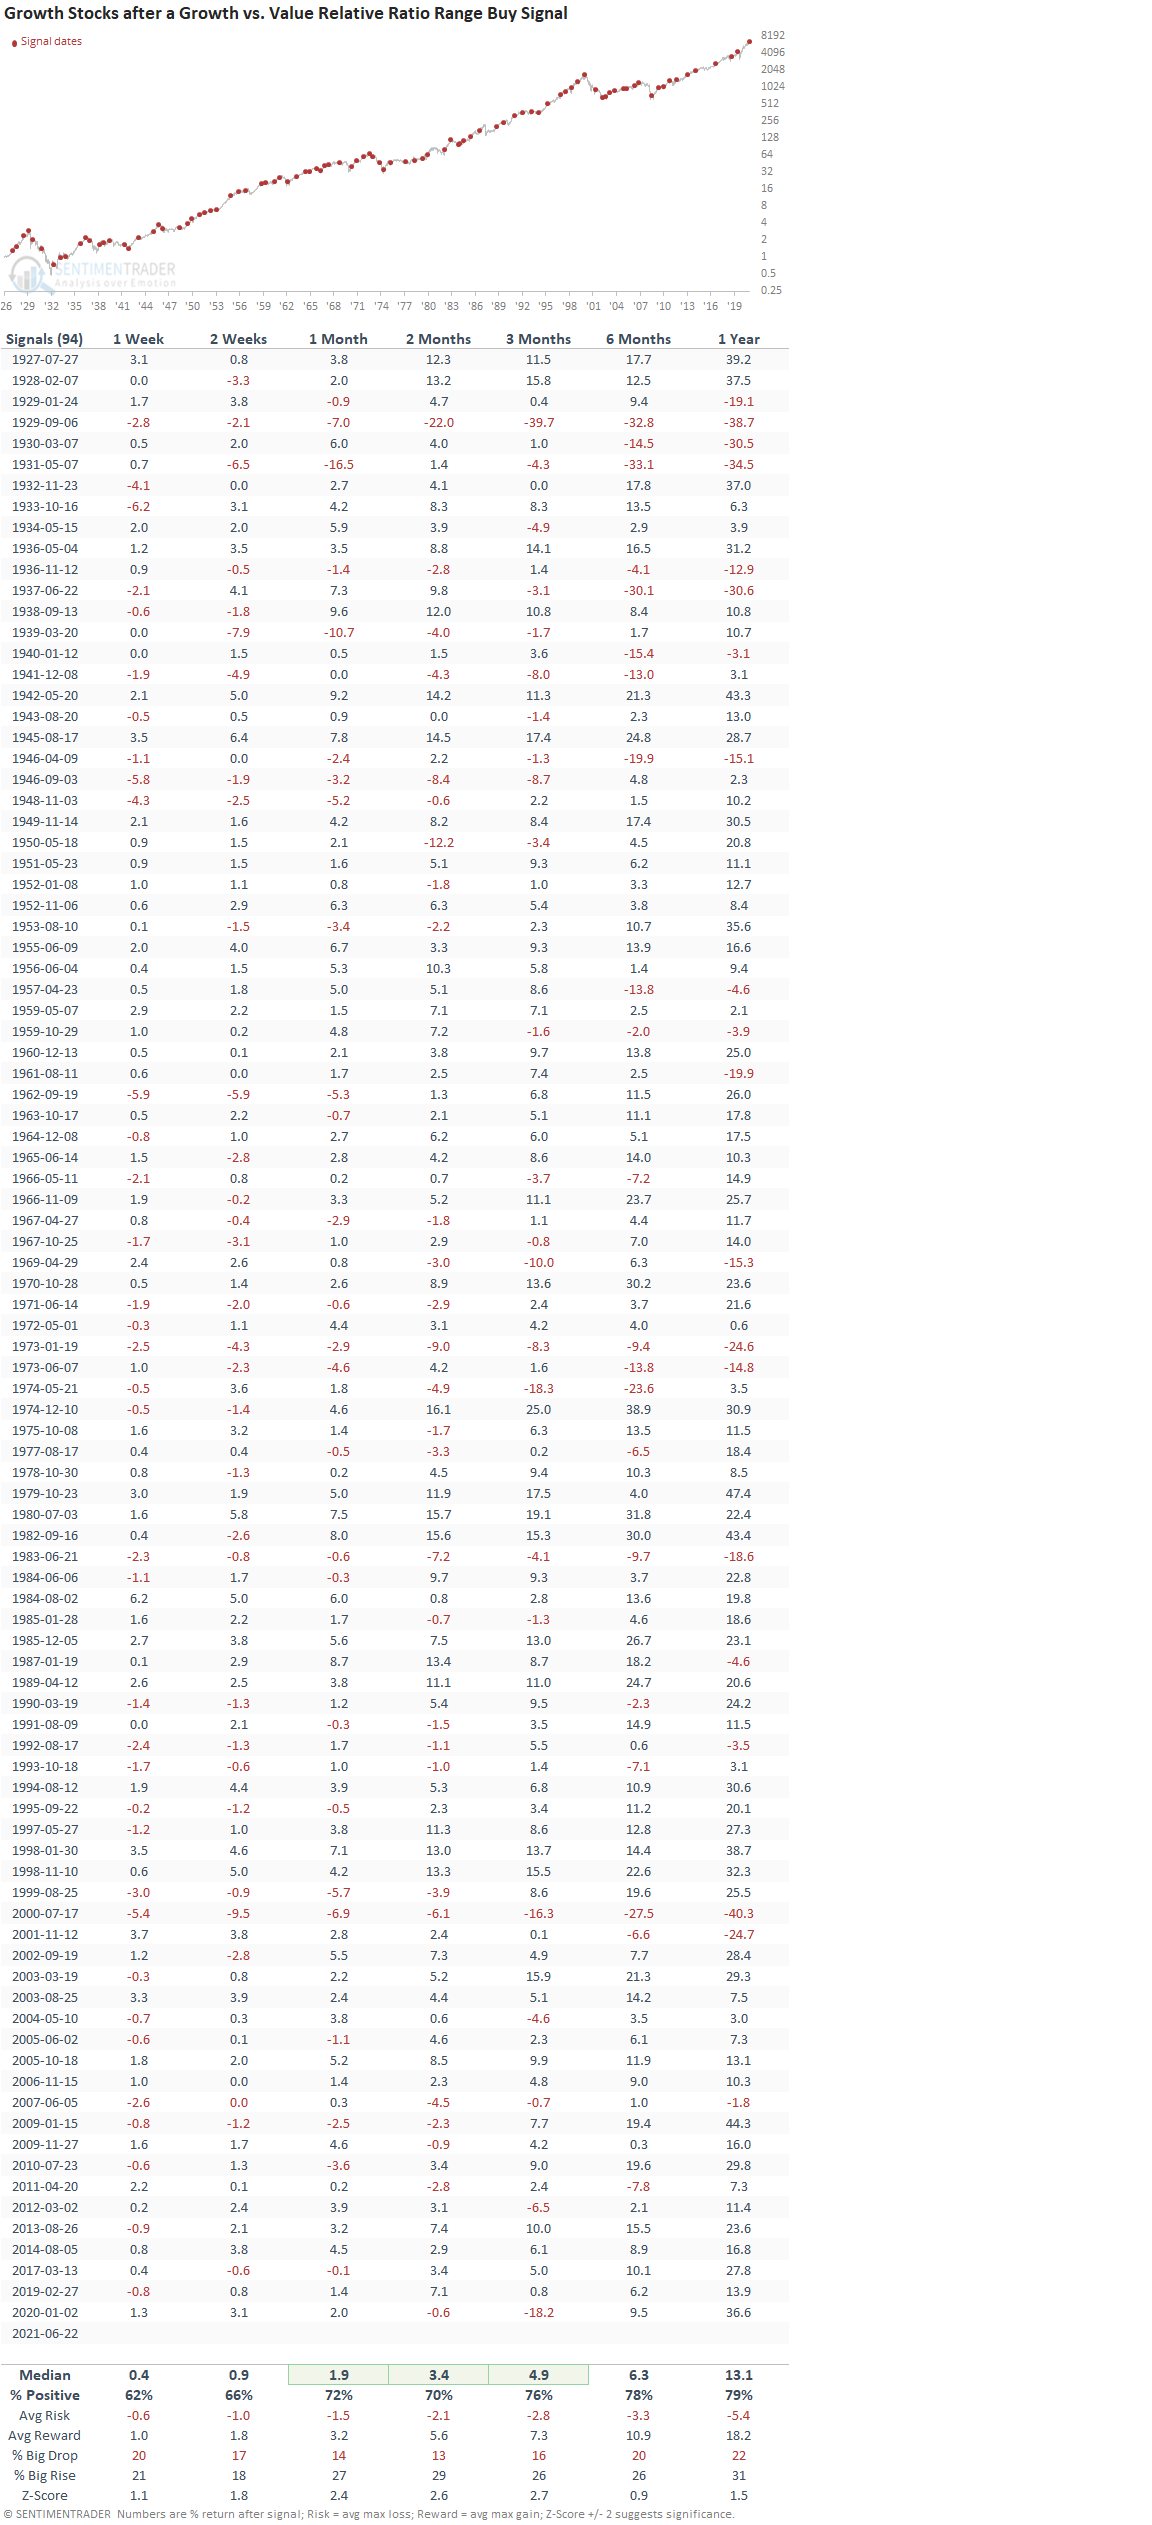
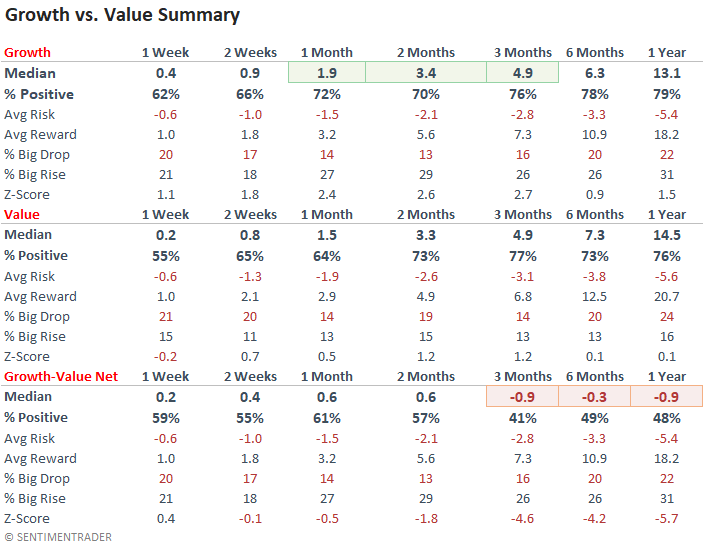
HOW THE SIGNALS PERFORMED - GROWTH

Growth performed well across all timeframes with several notable z-scores.

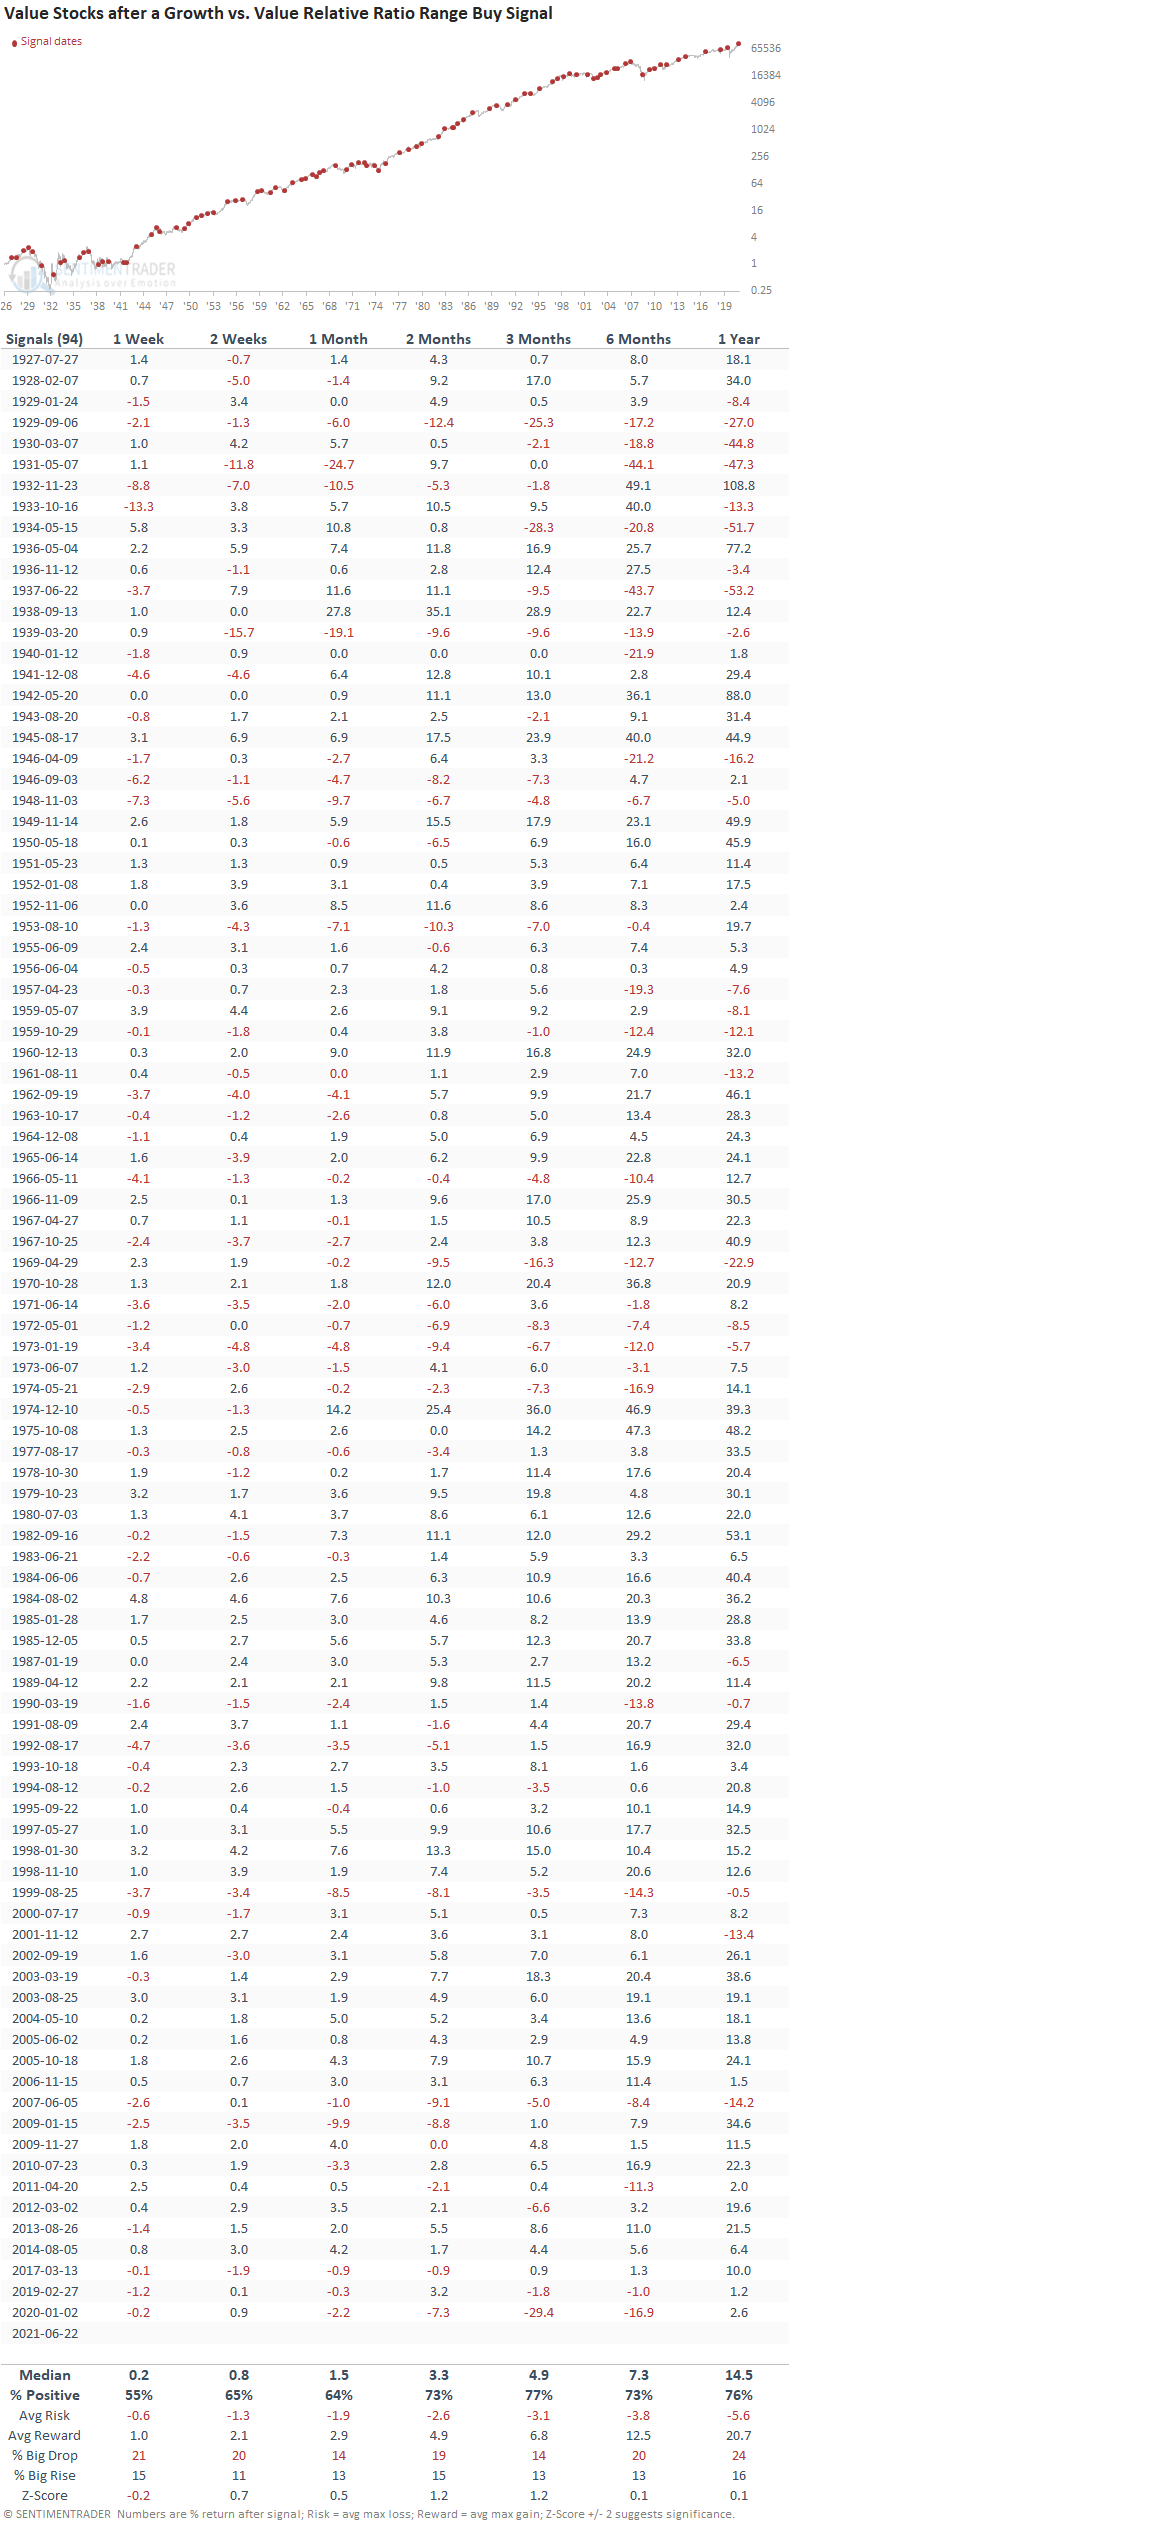
HOW THE SIGNALS PERFORMED - VALUE

If we bought the value index when growth triggered a signal, we see results that look okay. 

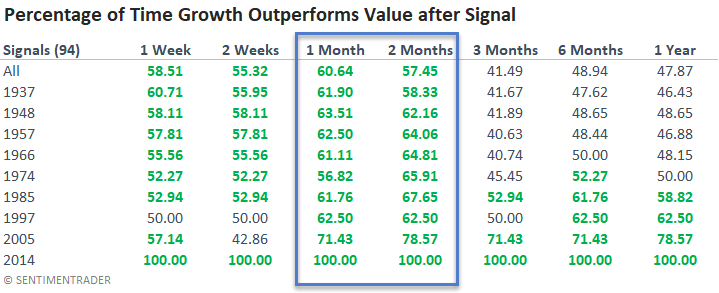
GROWTH VS. VALUE RELATIVE COMPARISON

The summary table suggests that one should favor growth for the time being as the short to intermediate-term results provide a slight edge. 

RELATIVE PERFORMANCE WALK FORWARD

The following table provides some context around the consistency of the growth signals through time. The win rate looks good on a short to intermediate-term basis, but especially of late. The shift to more consistent results on a long-term basis is interesting. Could the growth versus value dynamic be changing?

The walk forward for the win rate is calculated every ten signals.

Sorry, you don't have access to this report

Upgrade your subscription plan to get access
Go to Dasboard
DATA &
TECHnologies
IndicatorEdge
‍
BackTestEdge
‍
Other Tools
‍
DataEdge API
RESEARCH
reports
Research Solution
‍
Reports Library
‍
actionable
Strategies
Trading Strategies
‍
Smart Stock Scanner
‍
FREE
RESOUrCES
Simple Backtest
Calculator
Simple Seasonality
Calculator
The Kelly Criterion
Calculator
Sentiment Geo Map
‍
Public Research Reports
‍
Free Webinar
COMPANY
‍
About
‍
Meet our Team
‍
In the News
‍
Testimonials
‍
Client Success Stories
Pricing
Bundle pricing
‍
Announcements
‍
FAQ
© 2024 Sundial Capital Research Inc. All rights reserved.
Setsail Marketing
TermsPrivacyAffiliate Program
Risk Disclosure: Futures and forex trading contains substantial risk and is not for every investor. An investor could potentially lose all or more than the initial investment. Risk capital is money that can be lost without jeopardizing ones’ financial security or life style. Only risk capital should be used for trading and only those with sufficient risk capital should consider trading. Past performance is not necessarily indicative of future results.

Hypothetical Performance Disclosure: Hypothetical performance results have many inherent limitations, some of which are described below. No representation is being made that any account will or is likely to achieve profits or losses similar to those shown; in fact, there are frequently sharp differences between hypothetical performance results and the actual results subsequently achieved by any particular trading program. One of the limitations of hypothetical performance results is that they are generally prepared with the benefit of hindsight. In addition, hypothetical trading does not involve financial risk, and no hypothetical trading record can completely account for the impact of financial risk of actual trading. for example, the ability to withstand losses or to adhere to a particular trading program in spite of trading losses are material points which can also adversely affect actual trading results. There are numerous other factors related to the markets in general or to the implementation of any specific trading program which cannot be fully accounted for in the preparation of hypothetical performance results and all which can adversely affect trading results.

Testimonial Disclosure: Testimonials appearing on this website may not be representative of other clients or customers and is not a guarantee of future performance or success.