
A Nasdaq High/Low indicator flashes green

Key Points
- Bear markets are marked by daily new lows exceeding daily new highs, which indicates overall market weakness
- A certain amount of plurality favoring new lows typically signifies an ongoing decline
- However, when new lows begin to overwhelm new highs, it is typically a sign of a "washout" and often marks the ending portion of a bear market
- An indicator I developed many years ago gave a bullish signal on 5/12/2022
The JKHiLo Indicator: Combining indicators from two legendary analysts
Norman Fosback, the author of the market classic "Stock Market Logic," developed an indicator called The Hi/Lo Logic Index. I follow the NASDAQ version. Gerald Appel is best known as the inventor of the popular and widely used MACD (Moving Average Convergence/Divergence) indicator. Mr. Appel developed another indicator using daily high and low data. I have followed Fosback's and Appel's high/low indicators for over three decades and have found that combining the two creates a compelling and robust indicator of its own. For lack of imagination, I refer to this composite indicator as "JKHiLo."
The calculations
The Fosback Nasdaq HiLo Logic is calculated by taking the lower of daily Nasdaq new highs and new lows and dividing that number by the total number of issues traded that day on the Nasdaq exchange (then multiplying by 100). I then track the 10-day moving average of that calculation.
A = Nasdaq daily Total Issues
B = Nasdaq daily new highs
C = Nasdaq daily new lows
D = If B < C then D = B else D = C
E (Fosback Nasdaq HiLo Logic Index) = (D/A) * 100
F = 10-day moving average of E
The Appel indicator is simply the daily Nasdaq new highs divided by the daily total of Nasdaq new highs and new lows. I also track the 10-day moving average of that daily calculation.
G = B / (B+C)
H (Appel HiLo Indicator) = 10-day moving average of G
JKHiLo = (F * H) * 500
JKHiLo Interpretation
There are various ways to interpret JKHiLo readings, i.e., a rising indicator is good to a point, too high of a value suggests churning near a top, and a declining trend suggests a weakening market.
But the most important thing to note is when the daily reading drops to an excessively low level. Allow me to explain.
Suppose the Fosback indicator itself reaches a very low level. In that case, it means that either a) new highs are overwhelming new lows (which is bullish), or b) new lows are overwhelming new highs (which is ALSO bullish when it becomes too extreme - as new lows swamping new highs is typically a sign of capitulation near the end of a bearish trend).
Suppose the Appel indicator reaches an extremely low level. In that case, it also indicates that new lows are overwhelming new highs, which - again - at some point becomes overdone and signals a washed-out market.
Looking for JKHiLo signals
I look for a drop below 10.0 in JKHiLo to signal a potential turning area for the stock market. The table below displays when JKHiLo dropped below 10 for the first time in six months (overlapping signals occurred in October 1998 and January 2009 but are ignored here).
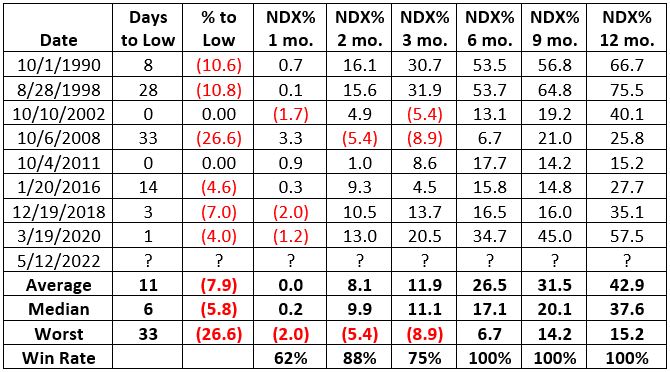
The main thing to jump out is the performance of the Nasdaq 100 Index 6, 9, and 12 months after a signal. Each of these periods is marked by a 100% Win Rate and very robust returns. However, the first three months after a signal can be a different matter, as we will discuss in more detail momentarily. Also, note that a new signal occurred on 5/12/2022.
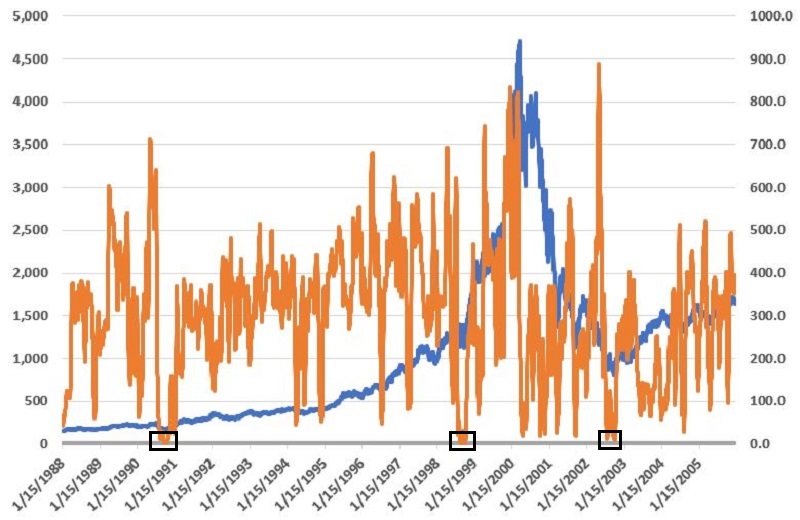
To help visualize things a little better, the chart below displays from 1988 through 2005:
- The action of the Nasdaq 100 Index (blue line with values on the left axis)
- The gyrations of JKHiLo (orange line with values on the right axis, with the 10.0 level marked by a grey horizontal line)
- The signals in the table above are highlighted with a black box
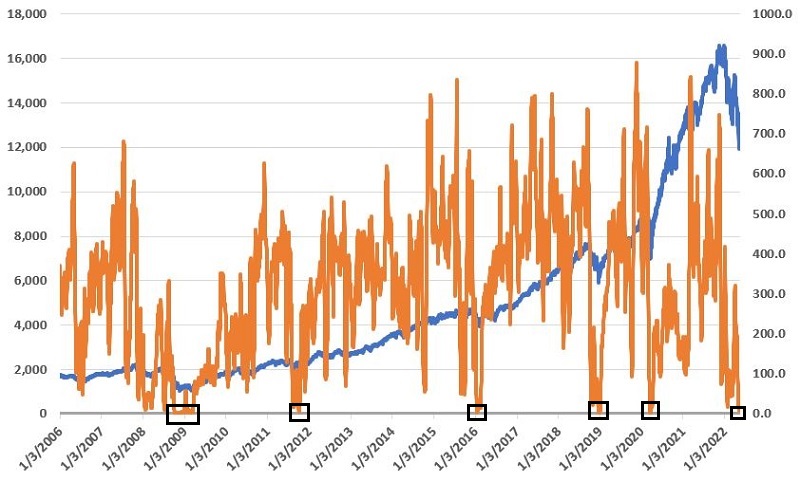
The chart below displays the action from 2006 to the present.
A closer look at the results
In all honesty, a part of me wants to shout, "Wow, just look at those 12-month returns!!" and write "The End." However, from my trading background, I have learned - painfully at times - that 12-month (even six-month) returns are all well and good, but only if you can hold on long enough to garner those returns. If things are "too rough" in the interim - whether financially or psychologically - a trader may be forced to bail out to preserve capital.
One essential thing to know about this signal - to paraphrase another market legend, Walter Deemer, "When this indicator gives a signal to buy, you won't want to." In other words, JKHiLo typically drops below 10 when things look their absolute worst and when investor fear is exceptionally high.
IMPORTANT NOTE: This seems like a good time to note that when JKHiLo gives a signal, it does not necessarily have to be an "All or Nothing" proposition for investors. For example, an investor might note that the worst may be over (or almost over) and wait for some preferred sign of bullish confirmation before "taking the plunge" back into the market. Another alternative is to commit x% of capital following the signal and the rest after some bullish confirmation.
So, to better understand things regarding JKHiLo, let's look at the previous signals (all bar charts below are courtesy of AIQ TradingExpert).
1990: The chart below displays the signal on 10/1/1990.
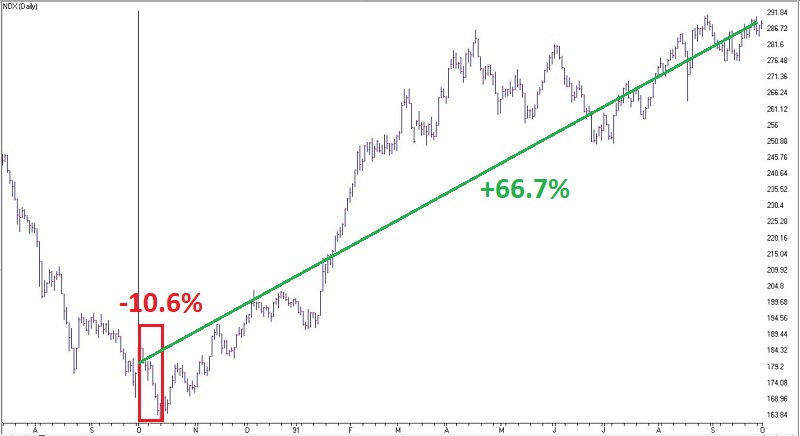
The good news is that NDX soared over 66% over 12 months. However, consider this: NDX had lost over -30% in roughly three months at the time of the signal, and fear was extremely high. To make matters worse, the index plunged another -10.6% in just eight trading days following the signal. DO NOT underestimate the intestinal fortitude required to jump into the teeth of a significant decline and THEN have the bottom drop out - albeit temporarily - after getting in.
1998: The chart below displays the signal on 8/28/1998.
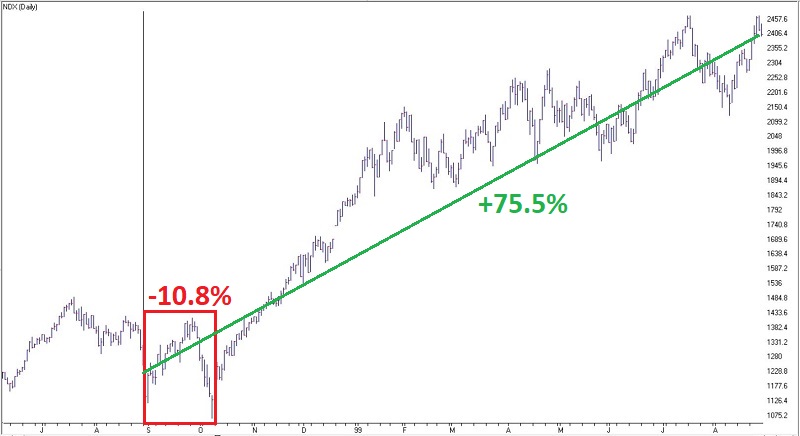
The market was highly volatile for several months following the signal, including a -10.8% decline to the bottom over 28 trading days - a very challenging environment.
2002: The chart below displays the signal on 10/10/2002.
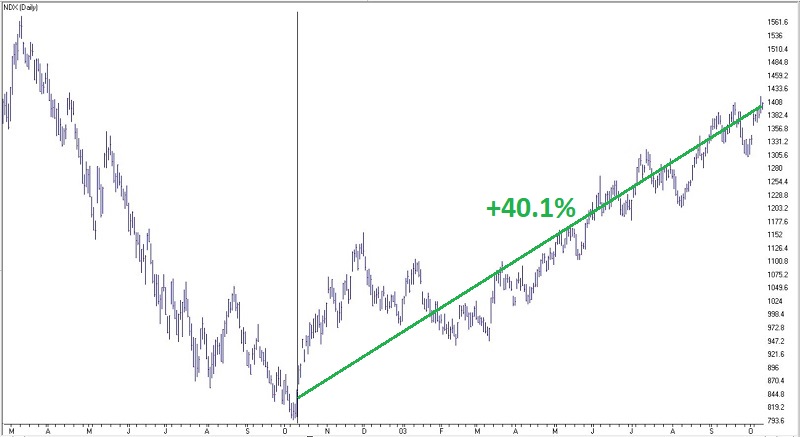
The good news is that NDX never closed lower after the signals. But again, picture your mindset in this situation. The Nasdaq 100 Index had just declined a staggering -83% in less than three years, including a -23% plunge in the last month and a half. Likewise, after the solid initial rally into November 2002, the index then chopped sideways violently for six months before finally moving decisively to the upside.
2008: The chart below displays the signal on 10/6/2008.
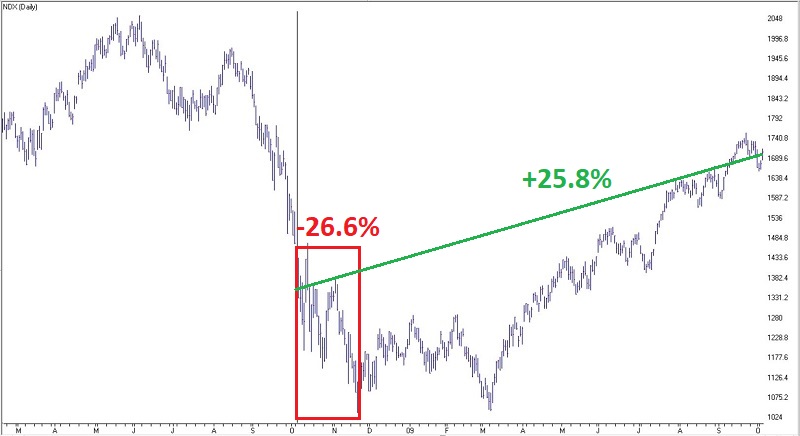
This represents the nightmare scenario. There is no other way to say it, but "this signal was too early." In the absolute "fiery pit of hell" that the Great Financial Crisis of 2008 was for investors, JKHiLo gave a buy signal as the express elevator was plunging to the basement. Over the 33 trading days after the 10/6/2008 signal, NDX lost another -26%. Even after it bottomed out in late November 2008 and rallied into February 2009, it experienced another harrowing -25% plunge into early March 2009.
2011: The chart below displays the signal on 10/4/2011.
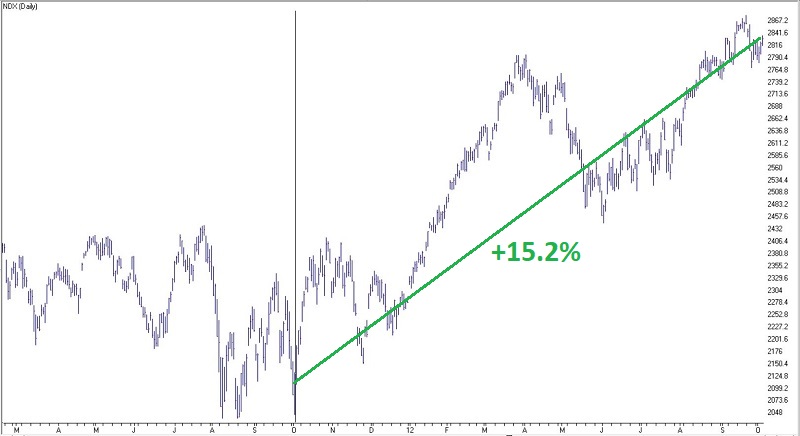
Much like 2002, this signal never saw NDX trade lower. However, it was another three months of "chop and doubt" before the index took off to the upside.
2016: The chart below displays the signal on 1/20/2016.
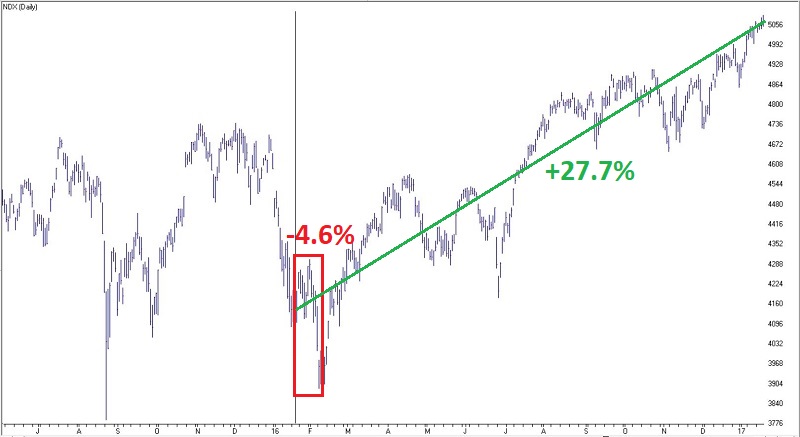
More of the same here: JKHiLo gave a signal into the teeth of a sharp plunge. Then NDX lost another -4.6% in just fourteen trading days (never underestimate how frightening a quick -4.6% decline can be in real-time - especially when you just bought into the market in anticipation of a new bull market).
2018: The chart below displays the signal on 12/19/2018.
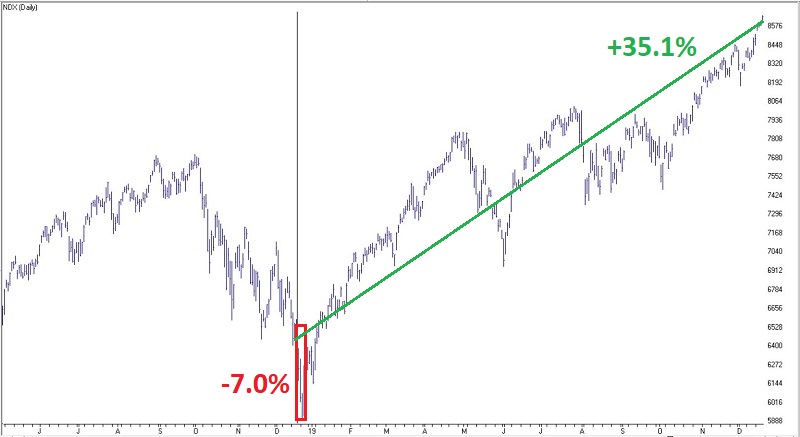
A classic. Following the signal date, NDX plunged a harrowing -7% in just three trading days leading up to Christmas. This is a time (pre-holiday) when the market usually rallies. As a seasonal trader myself, I remember the absolute disbelief as I turned the quote screen off on Christmas Eve day. Some prominent money managers violated their trading rules and went to cash just before the close, only to get left behind after the market turned and took off to the upside the very next trading day. Once more, never underestimate the psychological impact of the abject fear associated with market bottoms.
2020: The chart below displays the signal on 3/19/2020
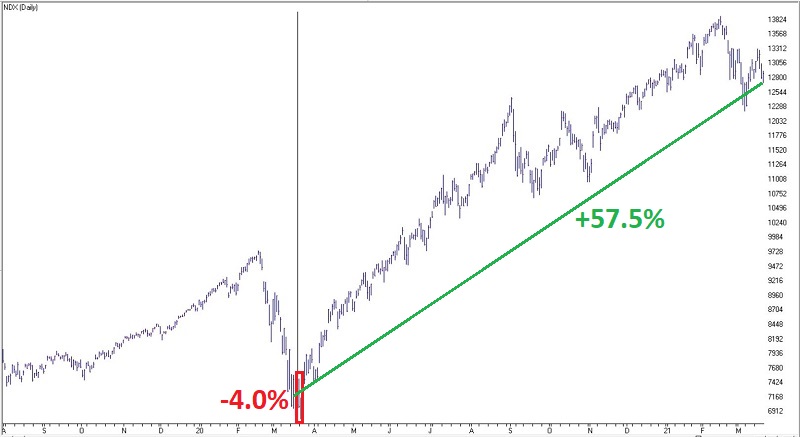
Pandemic, anyone? Imagine getting a buy signal after the market had just lost an unbelievable -30% in just one month, with uncertainty off the charts regarding not just the stock market but, at the time, the fate of humanity. That was the situation on 3/19/2020.
2022: The chart below displays the signal on 5/12/2022.
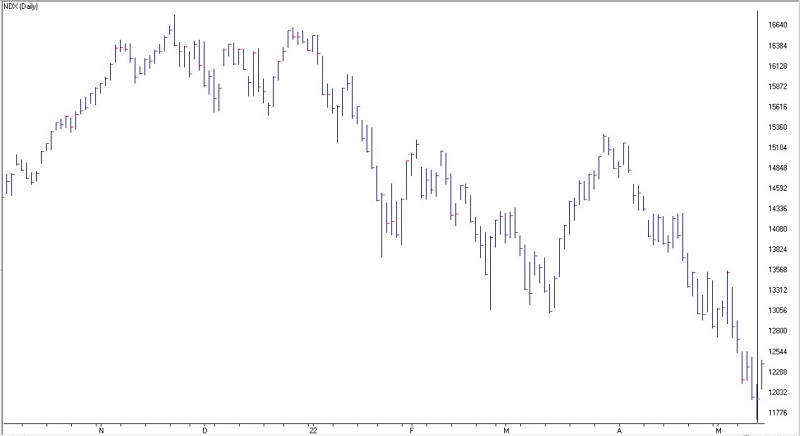
And so here we are. Massive debt. Soaring inflation. Rising interest rates. War. Talk of food shortages. And so on. And on 5/12, JKHiLo drops below 10.0. The good news is that NDX rallied almost +4% on Day 1. The bad news is that there is absolutely no way to know if this signal will prove anywhere as useful as previous signals. Nor can we say if it will follow the 2002 and 2011 model (i.e., no new lower lows), the 2008 model (massive follow-up pain), or even possibly something worse.
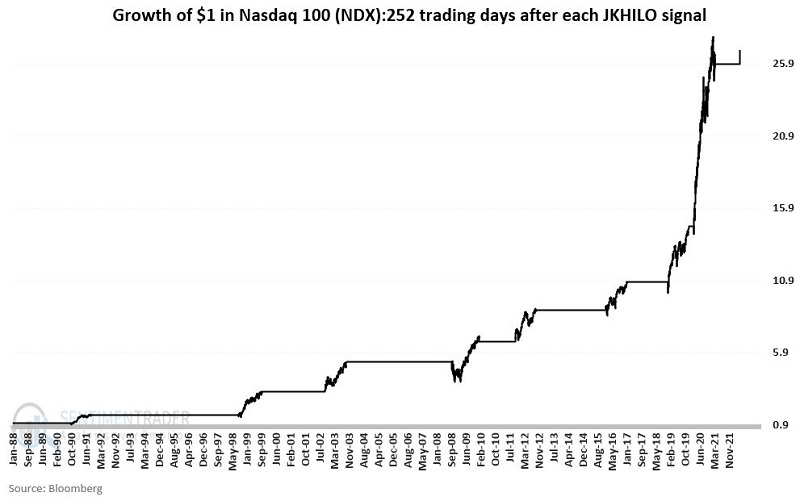
The big picture
The chart below displays the growth of $1 invested in NDX (this can be emulated by trading ticker QQQ which tracks the Nasdaq 100 index) held for 252 trading days after each signal (including overlap signals on 10/8/1998 and 1/23/2009).
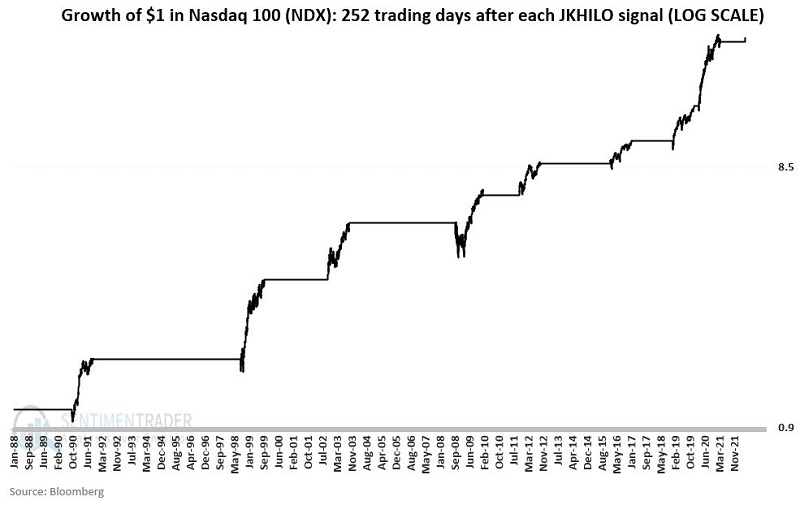
Just to cover all the bases, the chart below shows the same information in the chart above but on a logarithmic scale, to better reflect percentage changes from signal to signal.
What the research tells us…
The good news is that over the past 30 years, JKHiLo has done an excellent job of highlighting buying opportunities. The bad news is that each signal is its own "roll of the dice" with no guarantee of higher stock prices in the weeks and/or months ahead.
Still, the track record isn't bad.