
A multi-year breakout in commodities

Key points:
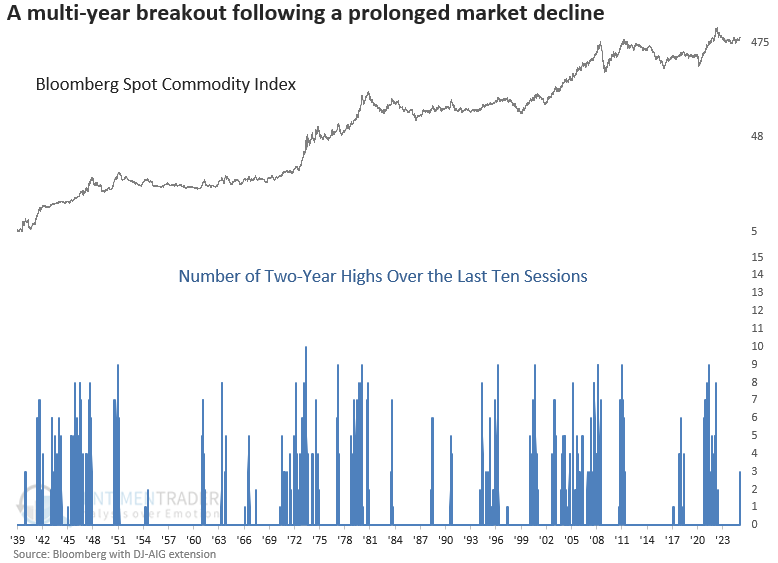
- Over the last ten sessions, a spot commodity index closed at a multi-year high on three occasions
- Similar breakouts suggest the rally in a broad basket of commodities could persist over the next year
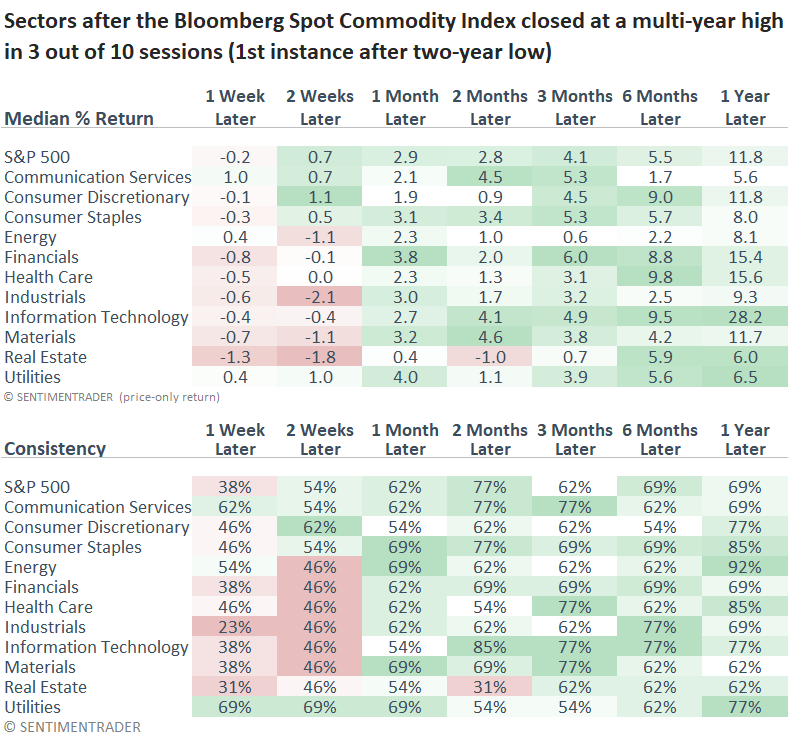
- The energy sector displayed the best consistency twelve months later, rallying 92% of the time
An emerging uptrend is taking shape in the commodities market
Over the last ten sessions, the Bloomberg Spot Commodity Index recorded a multi-year high on three occasions, a scenario that has occurred 13 other times since 1939 when isolating the first instance after a two-year low.
Market technicians typically employ two concepts when analyzing breakouts to ensure sustainability. One method counts the number of trading days above the initial breakout point, while the other records the number of sessions achieving a high in a lookback period. I chose the latter.
With recency bias regarding inflation at the forefront of investors' minds, especially after a hotter-than-expected headline CPI report this morning, commodities are a critical asset to monitor now that an emerging uptrend is underway.
Similar breakouts in commodities preceded positive returns
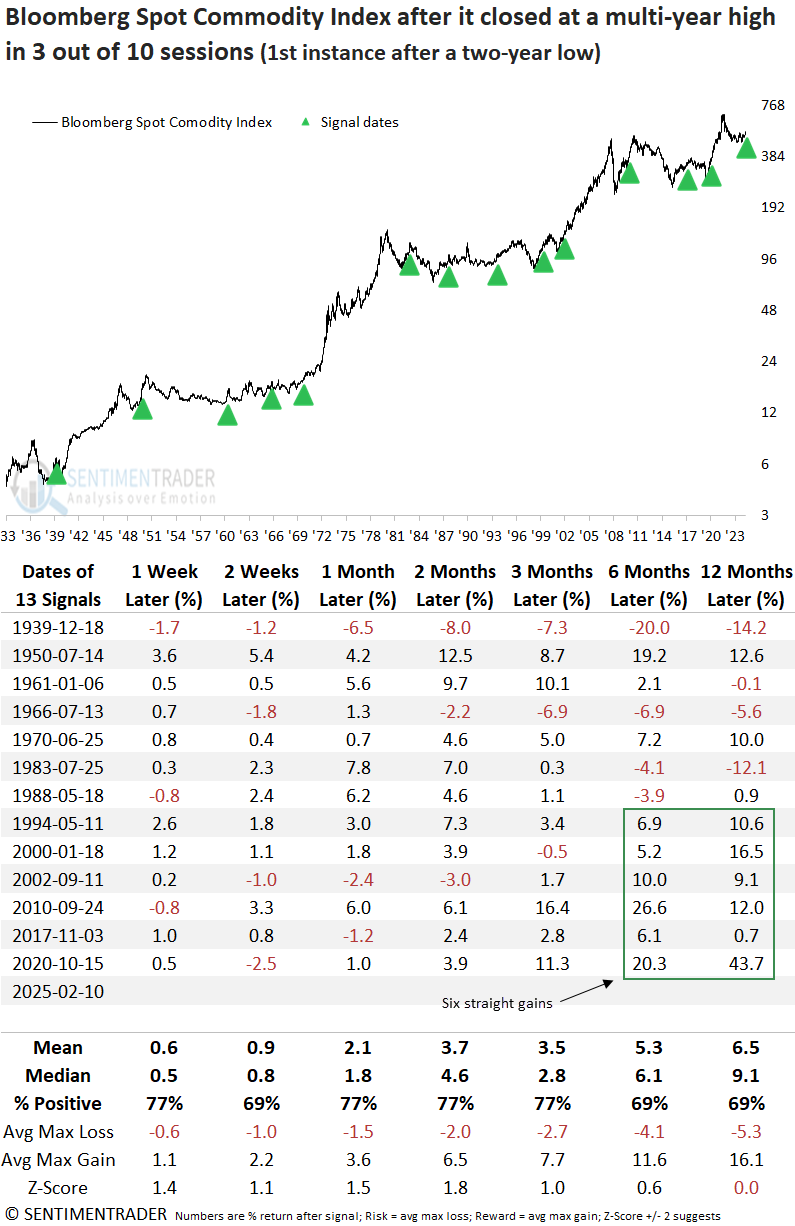
Whenever the Bloomberg Spot Commodity Index closed at a multi-year high in 3 out of 10 sessions for the first time after a two-year low, the rally in a broad basket of commodities tended to persist over the subsequent year.
The initial two months showed notable strength, with the index rallying 77% of the time for a median gain of 4.6%, nearly reaching statistical significance compared to random returns.
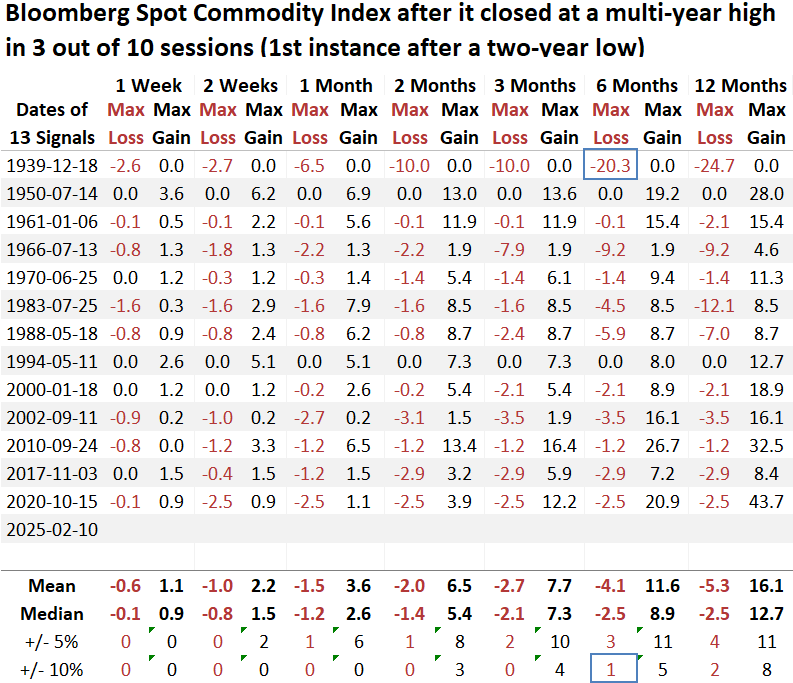
The Bloomberg Spot Commodity Index experienced only one maximum loss that surpassed -10 % over the next six months, a remarkable feat considering the inherent volatility in commodities.
What about stocks?
The energy sector rose in 92% of instances over the following year, posting a median gain of 8.1%. However, its average return of 18.3% outpaced all other sectors. Meanwhile, the materials sector, heavily tied to commodities, advanced 85% of the time in the next two months, delivering a median gain of 4.6%, the highest among all groups.
From a big-picture perspective, the stock market rallied alongside commodities, suggesting that the multi-year breakout aligns more with a reflationary phase associated with economic growth rather than a late-cycle inflationary spike that pressures equities.
What would make the commodity breakout even more compelling?
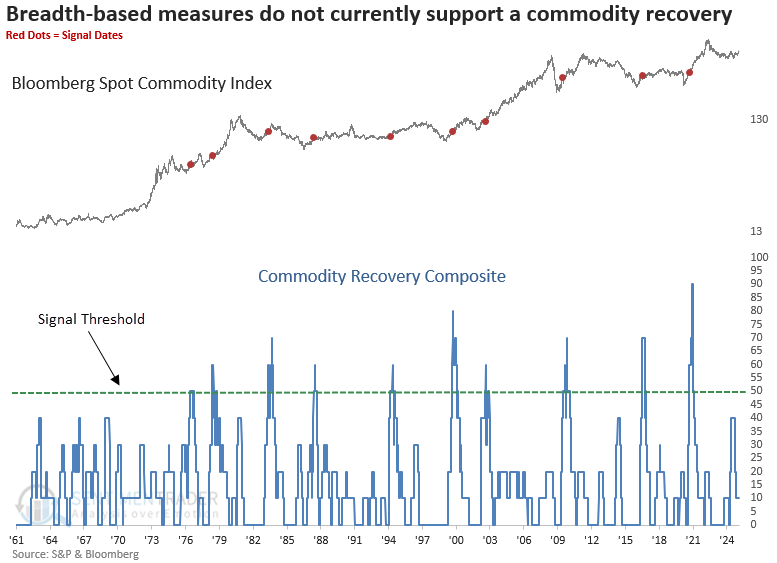
My Commodity Recovery Composite tracks index price trends and several market breadth indicators, such as the percentage of commodities trading above their 200-day average and those reaching 52-week highs. Although it fell short of a signal in May 2024, should more commodities join the rally, an alert could trigger, reinforcing the bullish case.
Additional evidence suggests reflation, not inflation
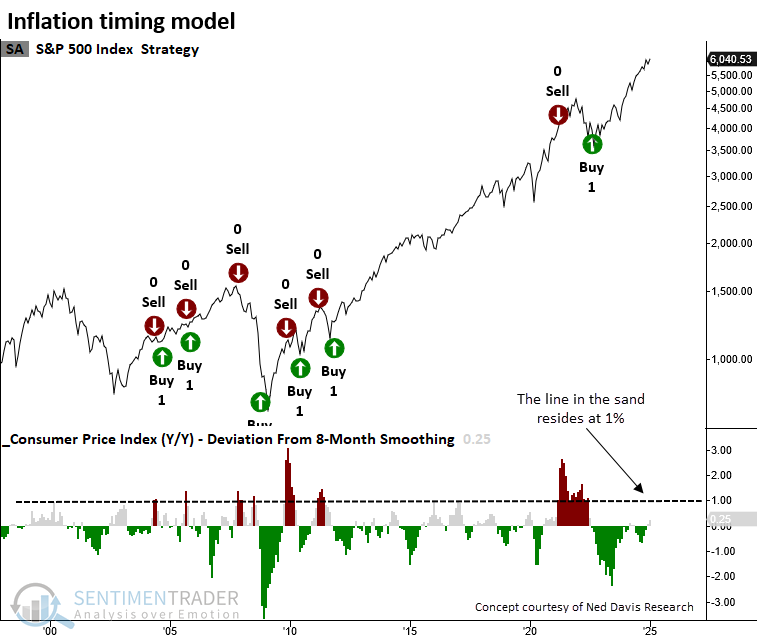
An inflation timing model that generates a sell signal for stocks when year-over-year CPI increases 1% above its eight-month smoothing is not currently poised to trigger an imminent alert, indicating that inflation remains contained. The following chart reflects today's CPI report.
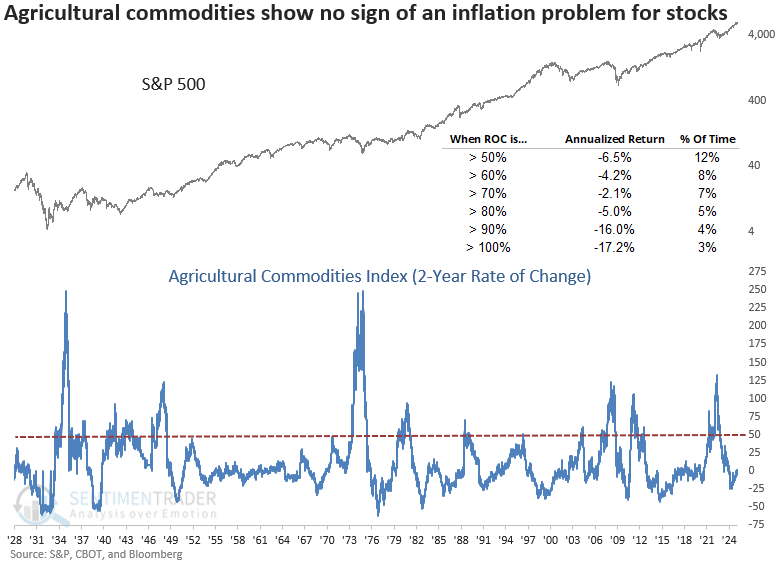
To assess inflationary pressures that could negatively impact equities, I also monitor the 2-year rate of change for a basket of agricultural commodities. With a current reading of 1%, it remains well below the threshold historically linked to negative annualized S&P 500 returns.
What the research tells us...
Commodities have rallied to a multi-year high, marking their first significant breakout following a two-year low. Historically, similar breakouts have led to a sustained rally over the following year, reinforcing the trend's strength. Notably, the emergence of a new commodity uptrend has not negatively impacted equities; stocks participated in the rally, indicating a reflationary phase often associated with economic expansion. Among sectors, energy demonstrated the highest win rate over the next year, while materials saw a sharp rally over a medium-term horizon. For now, rising commodity prices do not present a risk to equities, as several models have yet to reach levels that typically signal a drag on stock performance.