Data &
Technology
Research
Reports
Report Solutions
Reports Library
Actionable
Strategies
Free
Resources
Simple Backtest Calculator
Simple Seasonality Calculator
The Kelly Criterion Calculator
Sentiment Geo Map
Public Research Reports
Free Webinar
Pricing
Company
About
Meet Our Team
In the News
Testimonials
Client Success Stories
Contact
Log inLoginSign up
< BACK TO ALL REPORTS

A month when you had to work hard to lose money

Jason Goepfert
2020-12-03
In November, almost all major asset indexes rallied at least 1%.

The Capital Spectator blog noted something interesting on Tuesday - in November, everything rallied.

Looking at November returns across a broad spectrum of assets, it was impossible to find anything with a negative return. Among the indexes with the longest history, all of them even showing a gain of at least 1%. That includes stocks, bonds, commodities, and real estate.

To see if that's a sign of investor nirvana that might lead to at least a temporary reality check, the table below shows returns in the S&P 500 after any month when every index showed at least a 1% gain. 

S&P 500 after months when everything rallies

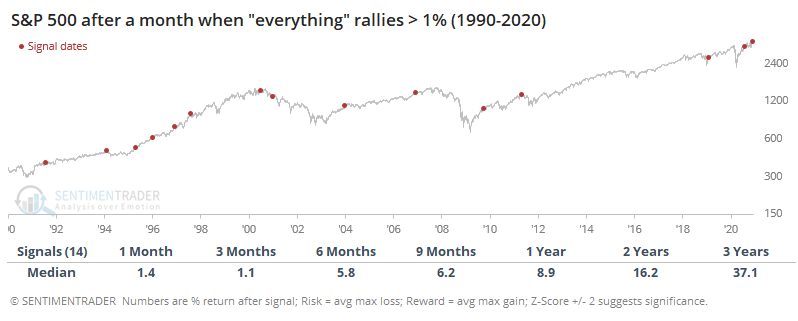
It didn't prove to be a consistent warning sign, but it wasn't exactly a buy signal, either. 

For other markets, they all showed a positive average return over the next 3 months. When it seems like everything is working, it tends to make contrarians nervous, and sometimes for good reason. After other months when it was hard to lose money, it was a good sign when coming out of a severe decline, but less so when triggering at all-time highs.


What else is happening

These are topics we explored in our most recent research. For immediate access with no obligation, sign up for a 30-day free trial now.

  • Full returns in the S&P 500 after months when everything rallied
  • Returns in other asset classes after those same months
  • For the 1st time in almost 3 years, newsletter writers are showing euphoria - what happens next

Stat Box

On Monday, financial stocks did something they haven't done for 3 years - every one of them was in an uptrend. The last time 100% of members in the S&P 500 Financials sector traded above their 200-day moving averages was in early 2017. It has been hard for the sector to keep this kind of momentum going - only 12 out of 50 days saw XLF trade at a higher price 3 months later.

Sentiment from other perspectives

We don't necessarily agree with everything posted here - some of our work might directly contradict it - but it's often worth knowing what others are watching.

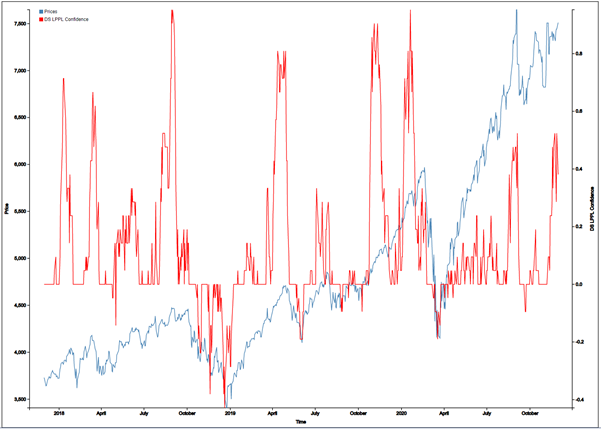
1. There is a bit of risk that technology stocks are in the beginning stages of bubble-like conditions. Using a sophisticated model of price changes, there is a slightly elevated short-term risk that these stocks have moved in a manner preceding risky conditions. [Financial Crisis Observatory]

technology stock bubble

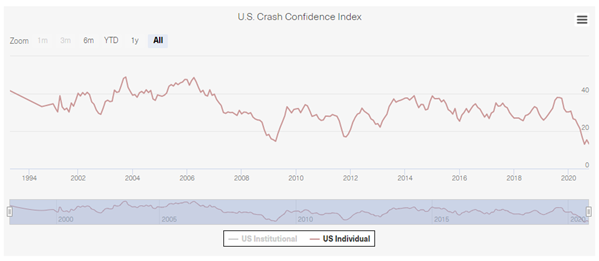
2. According to a Yale survey, individual investors in October have never been more confident that stocks will NOT crash. [Yale]

yale crash confidence

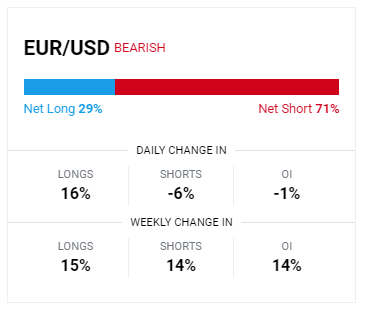
3. Foreign currency traders have become heavily short the Euro versus U.S. dollar. Typically, this is a non-contrary indicator at extremes. [Daily FX]

euro sentiment

DATA &
TECHnologies
IndicatorEdge
‍
BackTestEdge
‍
Other Tools
‍
DataEdge API
RESEARCH
reports
Research Solution
‍
Reports Library
‍
actionable
Strategies
Trading Strategies
‍
Smart Stock Scanner
‍
FREE
RESOUrCES
Simple Backtest
Calculator
Simple Seasonality
Calculator
The Kelly Criterion
Calculator
Sentiment Geo Map
‍
Public Research Reports
‍
Free Webinar
COMPANY
‍
About
‍
Meet our Team
‍
In the News
‍
Testimonials
‍
Client Success Stories
Pricing
Bundle pricing
‍
Announcements
‍
FAQ
© 2024 Sundial Capital Research Inc. All rights reserved.
Setsail Marketing
TermsPrivacyAffiliate Program
Risk Disclosure: Futures and forex trading contains substantial risk and is not for every investor. An investor could potentially lose all or more than the initial investment. Risk capital is money that can be lost without jeopardizing ones’ financial security or life style. Only risk capital should be used for trading and only those with sufficient risk capital should consider trading. Past performance is not necessarily indicative of future results.

Hypothetical Performance Disclosure: Hypothetical performance results have many inherent limitations, some of which are described below. No representation is being made that any account will or is likely to achieve profits or losses similar to those shown; in fact, there are frequently sharp differences between hypothetical performance results and the actual results subsequently achieved by any particular trading program. One of the limitations of hypothetical performance results is that they are generally prepared with the benefit of hindsight. In addition, hypothetical trading does not involve financial risk, and no hypothetical trading record can completely account for the impact of financial risk of actual trading. for example, the ability to withstand losses or to adhere to a particular trading program in spite of trading losses are material points which can also adversely affect actual trading results. There are numerous other factors related to the markets in general or to the implementation of any specific trading program which cannot be fully accounted for in the preparation of hypothetical performance results and all which can adversely affect trading results.

Testimonial Disclosure: Testimonials appearing on this website may not be representative of other clients or customers and is not a guarantee of future performance or success.