Data &
Technology
Research
Reports
Report Solutions
Reports Library
Actionable
Strategies
Free
Resources
Simple Backtest Calculator
Simple Seasonality Calculator
The Kelly Criterion Calculator
Sentiment Geo Map
Public Research Reports
Free Webinar
Pricing
Company
About
Meet Our Team
In the News
Testimonials
Client Success Stories
Contact
Log inLoginSign up
< BACK TO ALL REPORTS

A momentous shift in momentum

Jason Goepfert
2021-03-10
Over the past month, there has been a historic shift from growth to value stocks.

There has been a momentous shift in momentum. Former highflyers are losing altitude while stocks that had been left behind are storming back.

We saw this in the extreme movements between Technology and Financials and Energy.

All of these shifts have triggered a massive move in Value stocks relative to Growth. Over a rolling 1-month period, the total return on value is more than 10% greater than the total return on growth, one of the largest spreads in 30 years.

1 month value versus growth

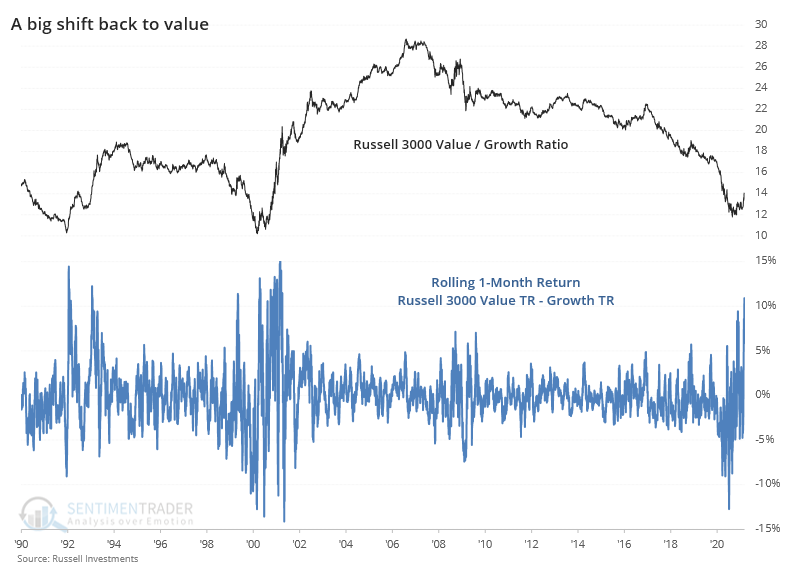
The last two shifts were notable, because they marked the ends of long periods of Value stock under-performance. In the years following those thrusts, Value stocks crushed Growth stocks.

It turns out that's more the rule than the exception.

The table below shows every time since 1928 when the total return on Value stocks over a rolling 21-day period was more than +5%, while the total return on Growth stocks was less than -5%.

What else we're looking at

  • Full returns in Value, Growth, Value vs Growth, and the S&P 500 after other big shits between the two factors
  • Even longer-term value is showing a consistent signal versus growth
  • What happens when the Nasdaq surges with most of its stocks in medium-term downtrends
  • Returns after the quickest corrections in Nasdaq history
  • The Shanghai Composite just entered a correction, too

Behind the Charts 

Check out this interview with Dave Keller of Stockcharts as SentimenTrader founder Jason Goepfert discusses the experiences that helped shape the company's beginnings.


Stat Box

For only the 9th time since 1928, on Tuesday, the S&P 500 gained more than 1.25% and yet more stocks in the index declined on the day than advanced.


Etcetera

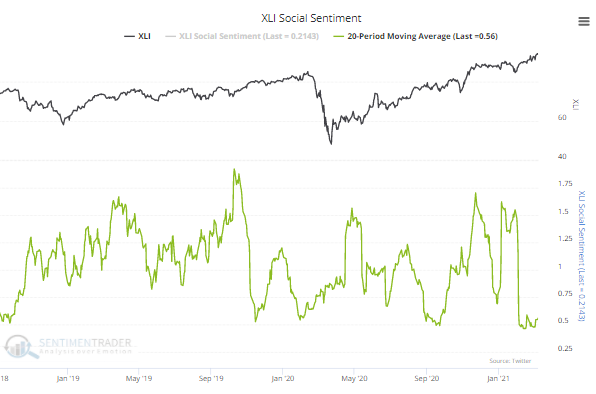
Twitter users love the relation trade. Social Sentiment on the Industrials ETF, XLI, has been skewed heavily toward positive messages on Twitter. Using AI analysis of mentions of the fund, the 20-day Social Sentiment score has dropped to one of the lowest levels in years. This functions like a put/call ratio, so low levels mean that there are fewer negative tweets than positive ones. 

xli social sentiment twitter

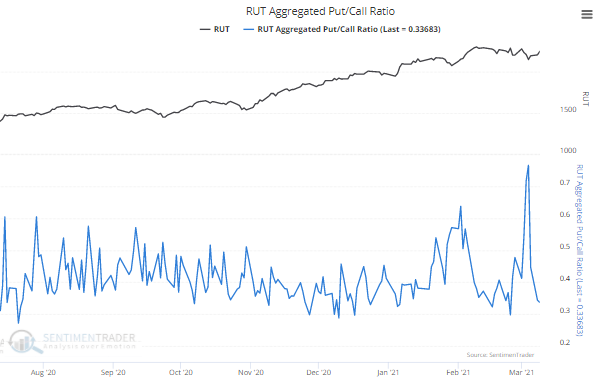
Traders love small-caps again, too. Yesterday, the put/call ratio aggregated across all stocks in the Russell 2000 dropped to an extremely low level, meaning there were relatively few put options traded relative to call options, a sign of optimism. That's a sudden change from the recent spike.

russell 2000 put call ratio


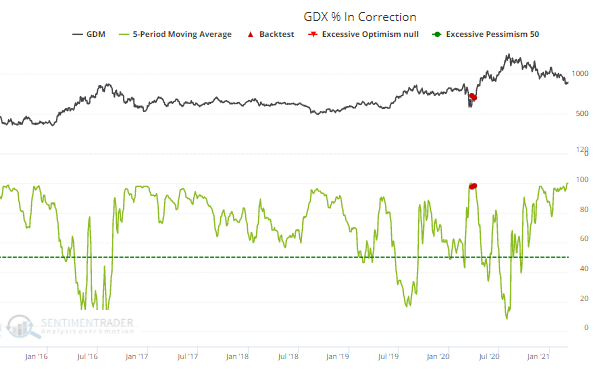
They do NOT love gold miners. Every gold mining stock we track is now in a correction, at least 10% below their highs. It's been this way for the past 5 sessions. The only other time in recent years that every miner was in a correction, and then reversed, is marked on the chart.

percentage of gold miners in correction

DATA &
TECHnologies
IndicatorEdge
‍
BackTestEdge
‍
Other Tools
‍
DataEdge API
RESEARCH
reports
Research Solution
‍
Reports Library
‍
actionable
Strategies
Trading Strategies
‍
Smart Stock Scanner
‍
FREE
RESOUrCES
Simple Backtest
Calculator
Simple Seasonality
Calculator
The Kelly Criterion
Calculator
Sentiment Geo Map
‍
Public Research Reports
‍
Free Webinar
COMPANY
‍
About
‍
Meet our Team
‍
In the News
‍
Testimonials
‍
Client Success Stories
Pricing
Bundle pricing
‍
Announcements
‍
FAQ
© 2024 Sundial Capital Research Inc. All rights reserved.
Setsail Marketing
TermsPrivacyAffiliate Program
Risk Disclosure: Futures and forex trading contains substantial risk and is not for every investor. An investor could potentially lose all or more than the initial investment. Risk capital is money that can be lost without jeopardizing ones’ financial security or life style. Only risk capital should be used for trading and only those with sufficient risk capital should consider trading. Past performance is not necessarily indicative of future results.

Hypothetical Performance Disclosure: Hypothetical performance results have many inherent limitations, some of which are described below. No representation is being made that any account will or is likely to achieve profits or losses similar to those shown; in fact, there are frequently sharp differences between hypothetical performance results and the actual results subsequently achieved by any particular trading program. One of the limitations of hypothetical performance results is that they are generally prepared with the benefit of hindsight. In addition, hypothetical trading does not involve financial risk, and no hypothetical trading record can completely account for the impact of financial risk of actual trading. for example, the ability to withstand losses or to adhere to a particular trading program in spite of trading losses are material points which can also adversely affect actual trading results. There are numerous other factors related to the markets in general or to the implementation of any specific trading program which cannot be fully accounted for in the preparation of hypothetical performance results and all which can adversely affect trading results.

Testimonial Disclosure: Testimonials appearing on this website may not be representative of other clients or customers and is not a guarantee of future performance or success.