
A member of the TCTM Composite Washout Model triggered an alert

Key points:
- A component in the Composite Washout Model triggered a bullish divergence alert
- Similar precedents suggest the S&P 500 could bounce over the subsequent two weeks
- The washout model's 10% signal count indicates that the market is not broadly oversold
A more compelling oversold condition awaits
Over the last few weeks, the research team has published several reports highlighting a deteriorating backdrop beneath the stock market's surface. Indexes and sectors have responded to the participation problem, especially risk-oriented groups like technology, which has fallen over 10% since reaching a new high on February 19th.
The critical question for investors: Is the market oversold? While some analysts argue yes, my indicators suggest otherwise. That's what makes a market.
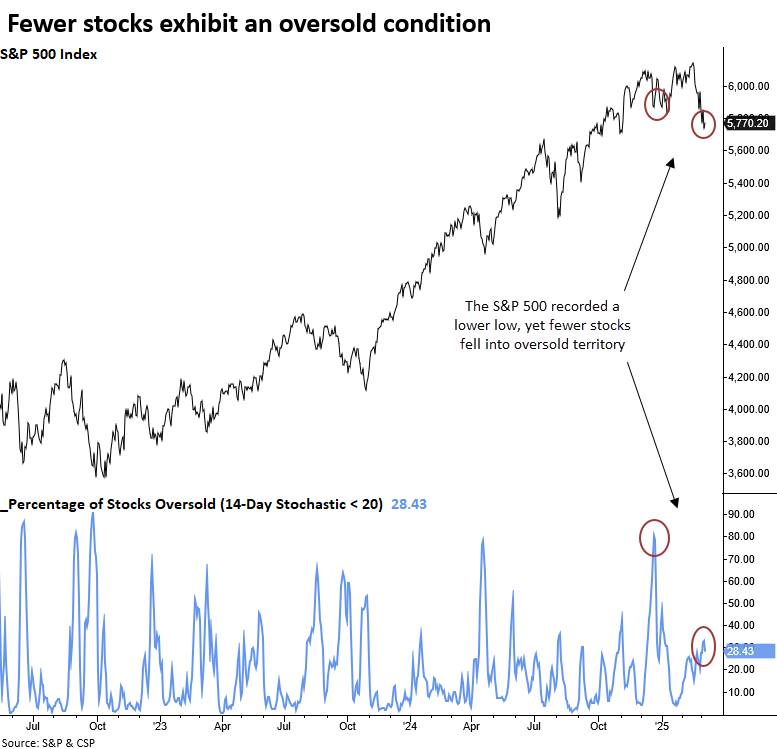
Despite the lack of a broad oversold condition, one TCTM Composite Washout Model member triggered an alert. This model detects divergences in the percentage of S&P 500 stocks classified as oversold based on a 14-day stochastic indicator, which functions like a range rank. Stochastic readings below 20% indicate oversold conditions.
Similar divergences preceded positive returns
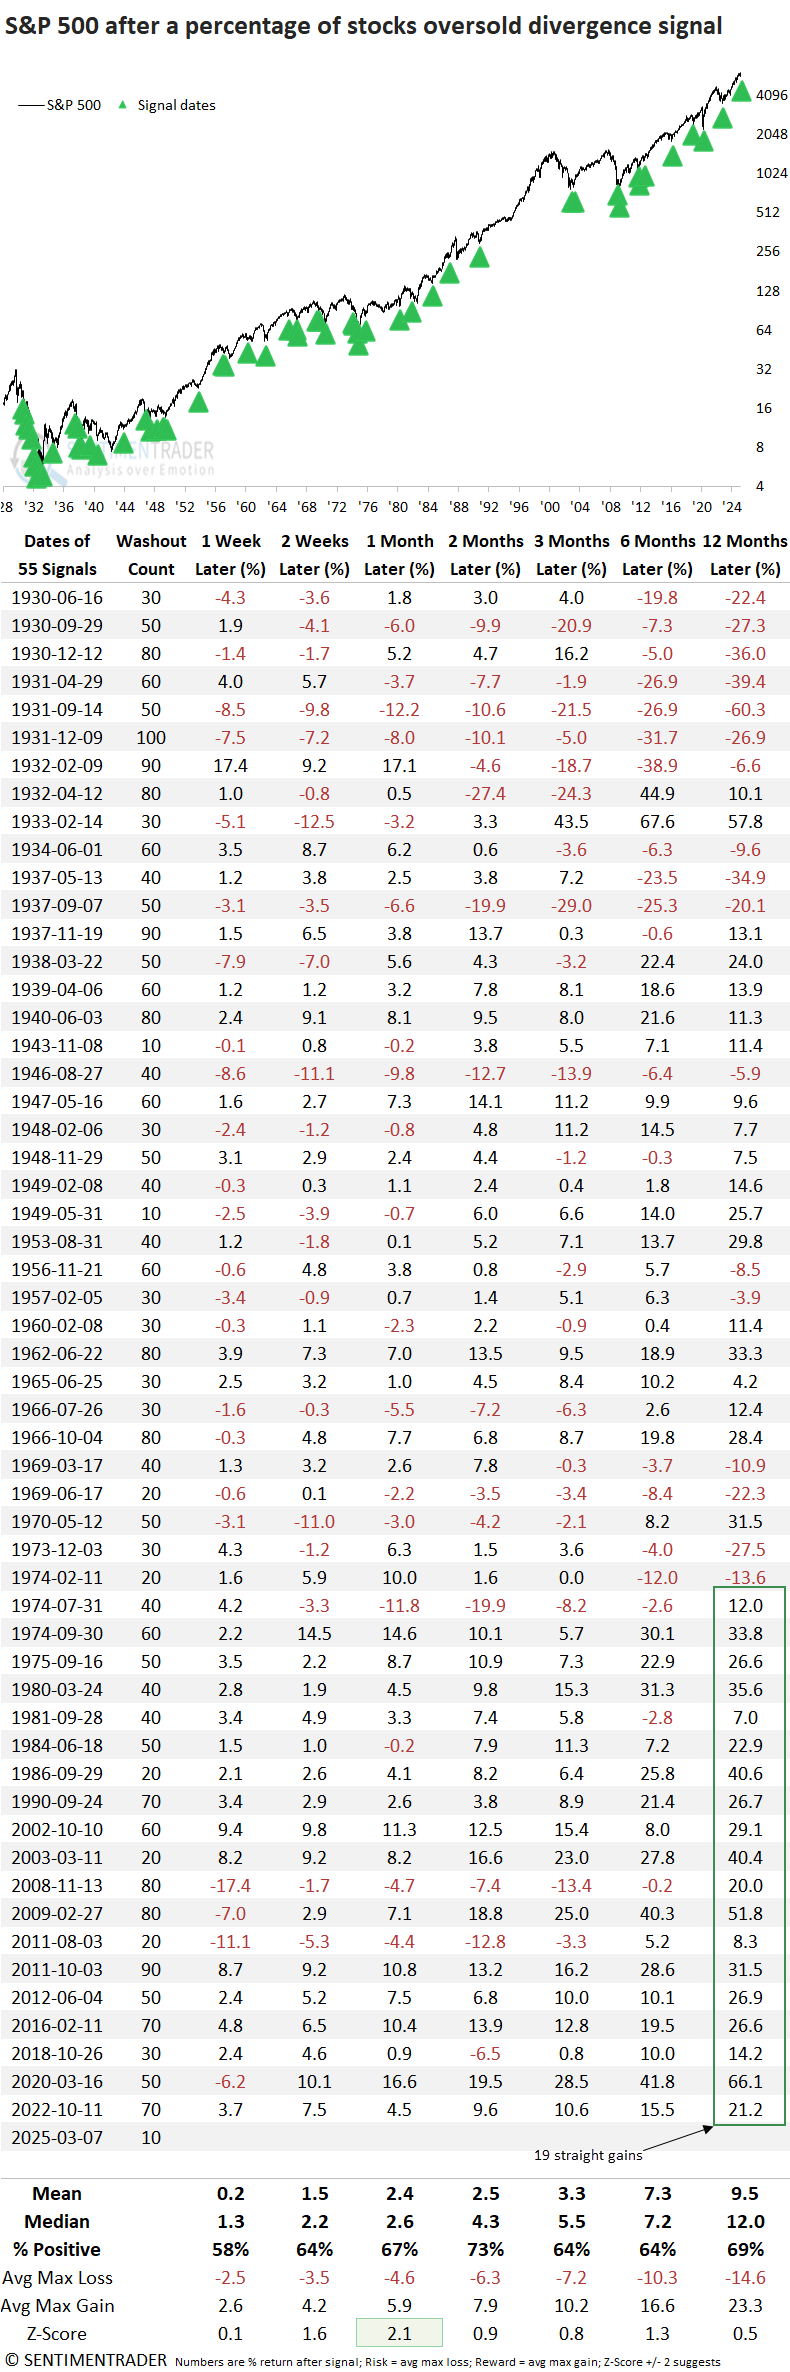
An oversold divergence signal has occurred 55 other times since 1930. Following similar precedents, the S&P 500 exhibited a solid tendency to rally, particularly over the following month, with statistically significant returns compared to random performance.
Oversold divergence signals usually appear at the depths of significant growth scares or bear markets, not within 10% of a multi-year high, as we see now. Furthermore, the Composite Washout Model count has historically averaged a reading of 50% when these divergence signals emerged, a sharp contrast from today's value of 10%. The only times in history when the signal count resided at 10%, like now, were 1943 and 1949.
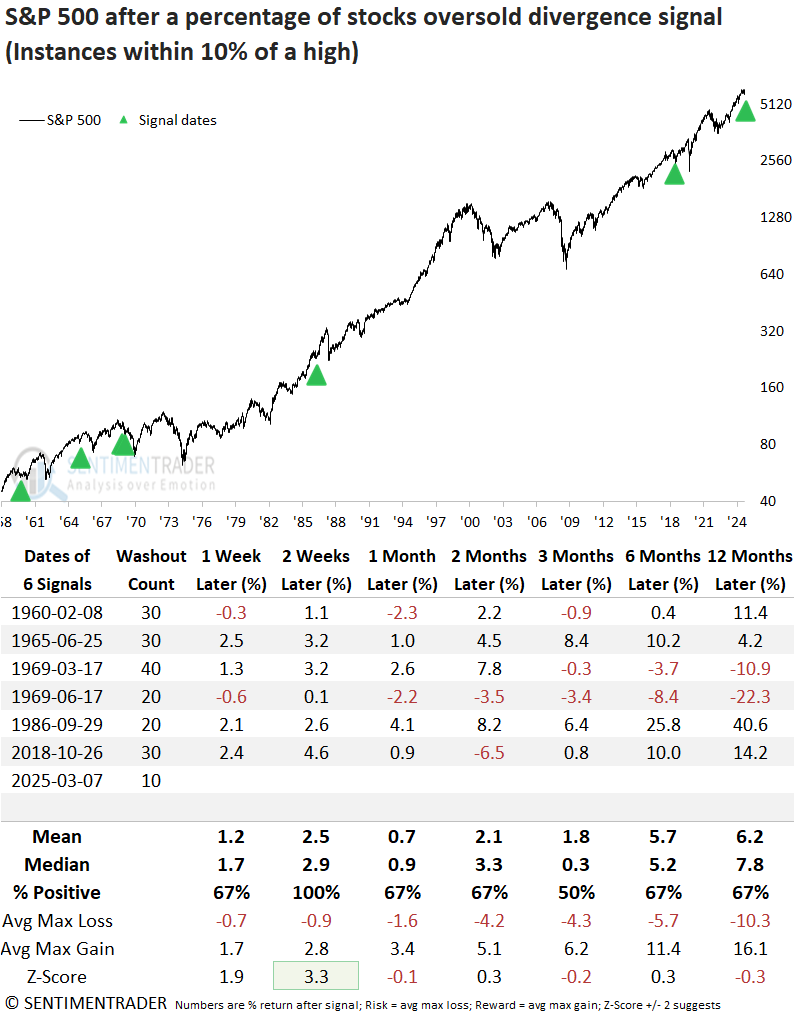
Although rare, oversold divergence signals that occurred within 10% of a multi-year high, like now, bounced 100% of the time over the subsequent two weeks. However, of the six precedents, four resulted in lower lows, with 1969 and 2018 exhibiting substantial further declines.
If the current correction deepens beyond a typical 10% pullback, the policy-driven growth score correction of 2018 could serve as a relevant comparison.
A comprehensive gauge of market breadth
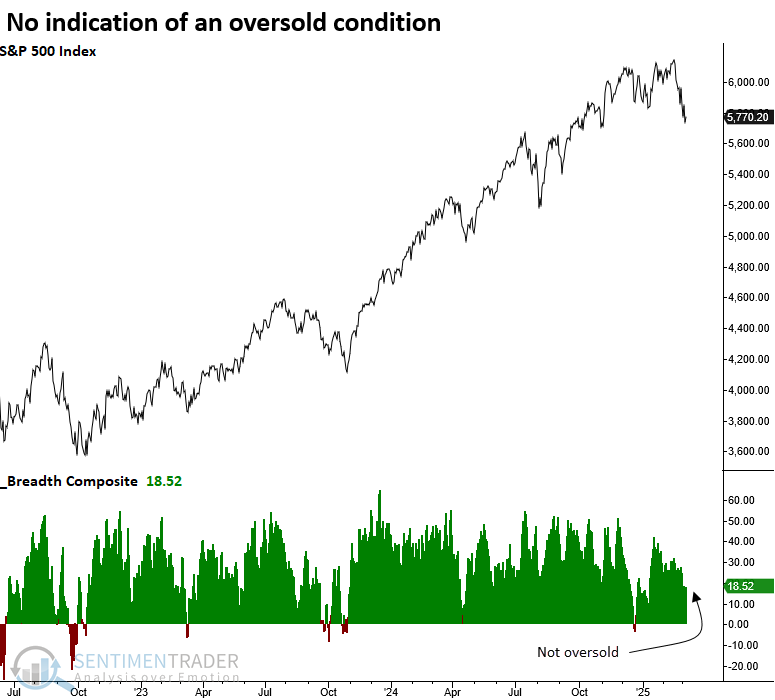
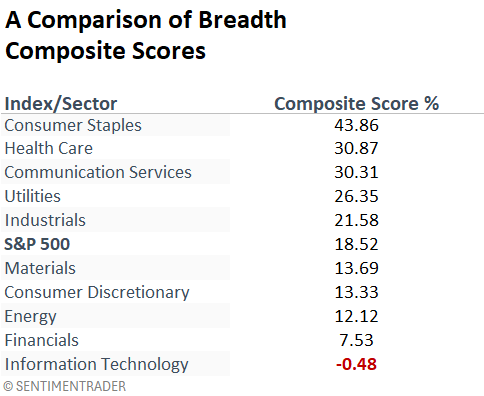
My breadth composite, which integrates six indicators with input durations spanning 10 to 252 days, currently stands at 18.52%-nowhere near an oversold condition.
Given today's developments, I anticipate the composite will tick down, eventually creating an oversold status that gives traders a more favorable risk/reward opportunity.
As of Friday's close, technology was the only sector with a negative breadth composite score, declining significantly over the last two weeks as defensive groups like staples and health care improved.
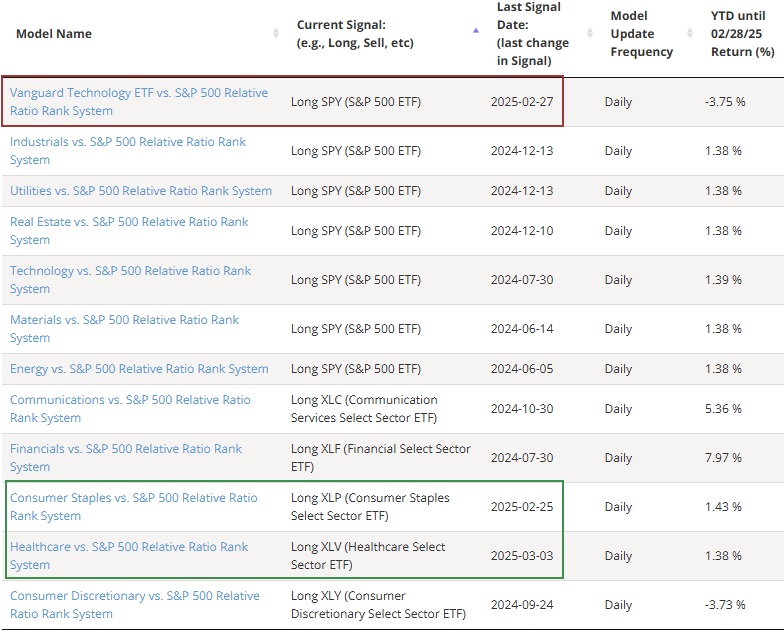
Relative strength
If you've been following the strategies page, you may have noticed a shift in the relative strength timing systems. The models reflect more defensive positioning, adding staples and health care while trimming technology.
What the research tells us...
A TCTM Composite Washout Model component triggered an alert when the S&P 500 declined to a lower low as fewer stocks within the index registered an oversold status, creating a bullish breadth divergence. Similar precedents have led to rebounds, particularly when they occurred near prior highs. However, with the composite washout signal count at just 10%, there is no meaningful oversold condition-an important contrast to past instances. Additionally, a secondary measure of breadth conditions does not indicate an oversold status, reinforcing the need for caution until a more compelling setup emerges. For now, traders would be wise to exercise patience.