Data &
Technology
Research
Reports
Report Solutions
Reports Library
Actionable
Strategies
Free
Resources
Simple Backtest Calculator
Simple Seasonality Calculator
The Kelly Criterion Calculator
Sentiment Geo Map
Public Research Reports
Free Webinar
Pricing
Company
About
Meet Our Team
In the News
Testimonials
Client Success Stories
Contact
Log inLoginSign up
< BACK TO ALL REPORTS

A major breakout in recovery sector stocks

Jason Goepfert
2021-02-25
On Wednesday, there was a surge in 52-week highs among members of the Energy, Financial, Industrial, and Material sectors, those most geared to an economic recovery. Other times over the past 70 years when those sectors saw this kind of breakout, stocks struggled over the medium-term.

Earlier this week, financial stocks enjoyed a broad breakout, with nearly 30% of stocks in the sector breaking out to at least a 52-week high.

It's only gotten better from there. And they've been joined by a bunch of recovery-sector buddies, too.

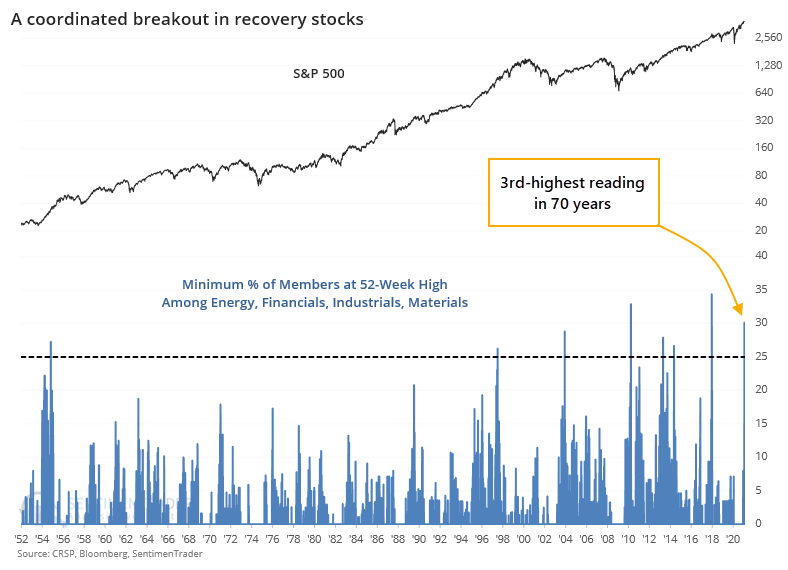
Among all indexes and sectors, the four horsemen of a recovery - Energy, Financials, Industrials, and Materials - are leading the charge. At least 30% of member stocks in all four of those sectors reached a new high on Wednesday. That's among the most impressive breakouts in 70 years for sectors geared to an economic recovery.

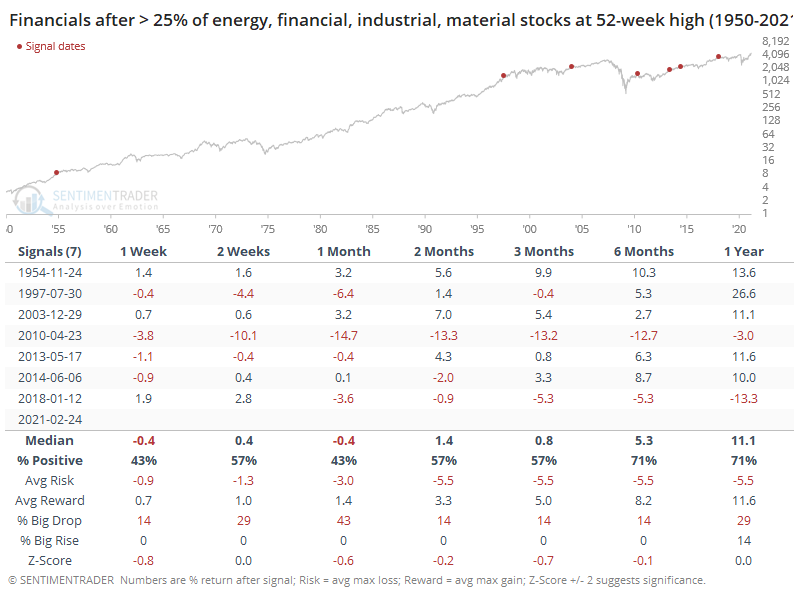
Let's check to see whether other coordinated breakouts from these sectors have preceded consistent returns. The table below shows forward returns in the S&P 500 (price only) following any day when at least 25% of members in all four of those sectors hit a 52-week high.

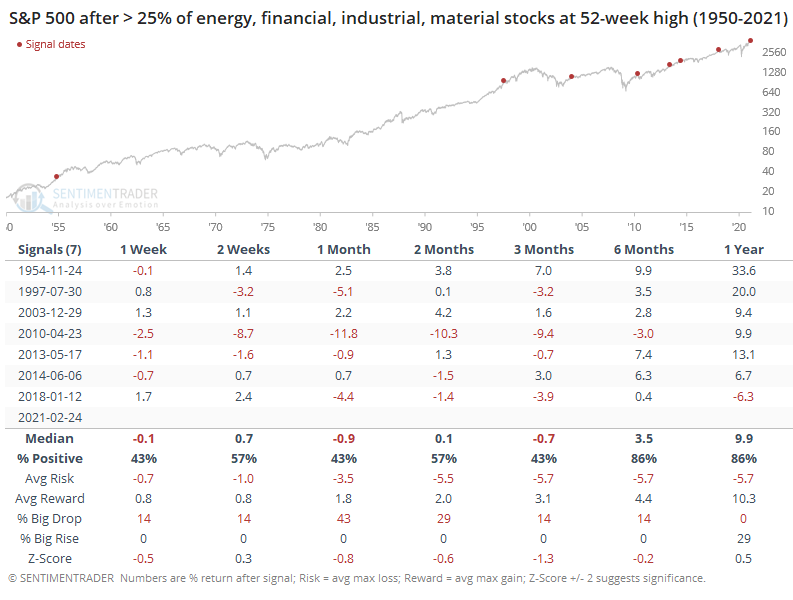
Over the short- to medium-term, returns weren't great. The S&P's median return was well below random, risk was higher than reward, and it had a greater chance of suffering a big drop than enjoying a big rise. That started to change after a few months, and by a year later, things were looking better.

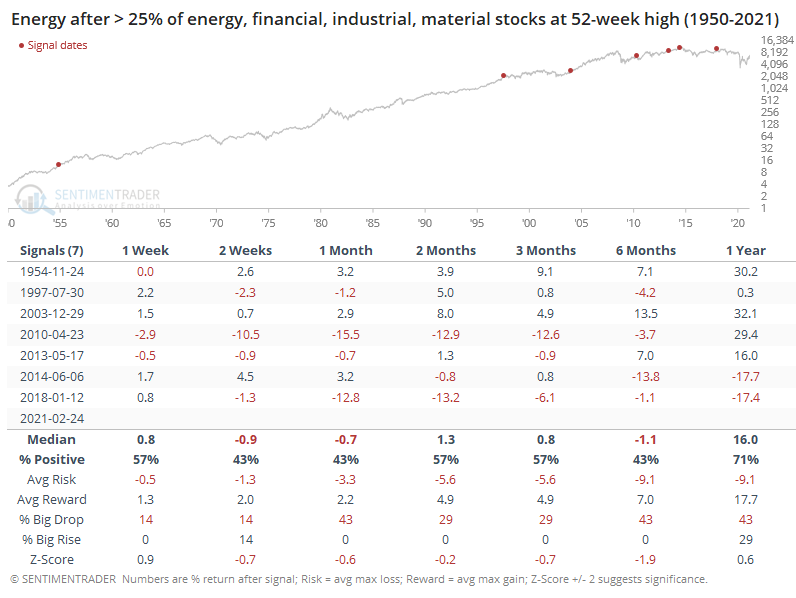
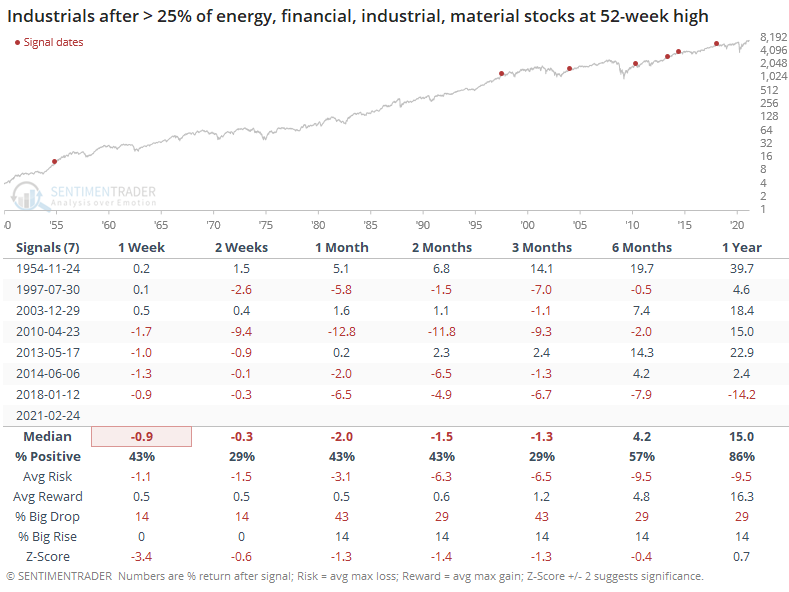
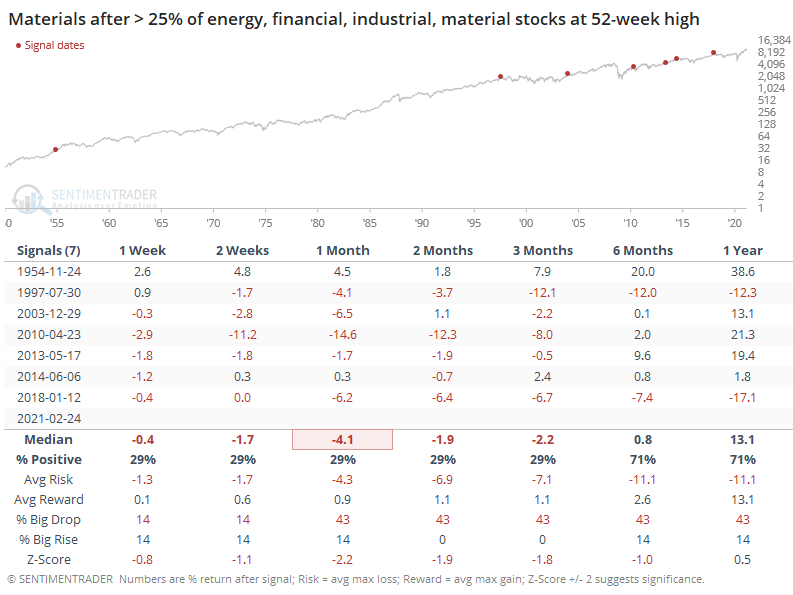
We can see returns for each of the four sectors below. These are total return, so it includes price change and dividends. Among them, Financials generally held up the best, Energy was next, then Industrials and Materials brought up the rear. It was rare for the latter two to show gains at all over the next few months.

The story surrounding these breakouts sounds great, and the news is looking good. Of course, it was the exact opposite scenario 11 months ago, and look where we are now. After some spotty days in January, the extreme (maybe even record) speculative activity we've seen in recent months has not preceded internal deterioration. Breadth and momentum remain strong, and that bodes well longer-term. In the interim, the biggest negative is just that things have been so positive for so long, they rarely keep going uninterrupted over a 2-3 month time frame.

Sorry, you don't have access to this report

Upgrade your subscription plan to get access
Go to Dasboard
DATA &
TECHnologies
IndicatorEdge
‍
BackTestEdge
‍
Other Tools
‍
DataEdge API
RESEARCH
reports
Research Solution
‍
Reports Library
‍
actionable
Strategies
Trading Strategies
‍
Smart Stock Scanner
‍
FREE
RESOUrCES
Simple Backtest
Calculator
Simple Seasonality
Calculator
The Kelly Criterion
Calculator
Sentiment Geo Map
‍
Public Research Reports
‍
Free Webinar
COMPANY
‍
About
‍
Meet our Team
‍
In the News
‍
Testimonials
‍
Client Success Stories
Pricing
Bundle pricing
‍
Announcements
‍
FAQ
© 2024 Sundial Capital Research Inc. All rights reserved.
Setsail Marketing
TermsPrivacyAffiliate Program
Risk Disclosure: Futures and forex trading contains substantial risk and is not for every investor. An investor could potentially lose all or more than the initial investment. Risk capital is money that can be lost without jeopardizing ones’ financial security or life style. Only risk capital should be used for trading and only those with sufficient risk capital should consider trading. Past performance is not necessarily indicative of future results.

Hypothetical Performance Disclosure: Hypothetical performance results have many inherent limitations, some of which are described below. No representation is being made that any account will or is likely to achieve profits or losses similar to those shown; in fact, there are frequently sharp differences between hypothetical performance results and the actual results subsequently achieved by any particular trading program. One of the limitations of hypothetical performance results is that they are generally prepared with the benefit of hindsight. In addition, hypothetical trading does not involve financial risk, and no hypothetical trading record can completely account for the impact of financial risk of actual trading. for example, the ability to withstand losses or to adhere to a particular trading program in spite of trading losses are material points which can also adversely affect actual trading results. There are numerous other factors related to the markets in general or to the implementation of any specific trading program which cannot be fully accounted for in the preparation of hypothetical performance results and all which can adversely affect trading results.

Testimonial Disclosure: Testimonials appearing on this website may not be representative of other clients or customers and is not a guarantee of future performance or success.