Data &
Technology
Research
Reports
Report Solutions
Reports Library
Actionable
Strategies
Free
Resources
Simple Backtest Calculator
Simple Seasonality Calculator
The Kelly Criterion Calculator
Sentiment Geo Map
Public Research Reports
Free Webinar
Pricing
Company
About
Meet Our Team
In the News
Testimonials
Client Success Stories
Contact
Log inLoginSign up
< BACK TO ALL REPORTS

A major breadth reversal with a compelling record just triggered

Jason Goepfert
2021-12-10
Short-term S&P 500 breadth generated a buy signal. Corn is entering a very favorable period. South Korean stocks are oversold and sentiment is pessimistic.

An S&P 500 breadth reversal buy signal for stocks

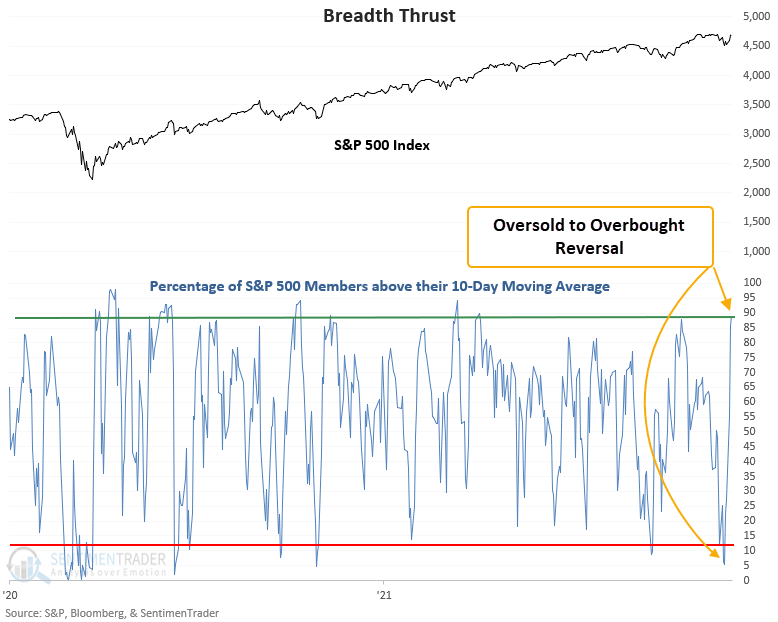
A new signal from a voting member in Dean's TCTM Composite Thrust Model issued an alert at the close of trading on Wednesday. The component is called the percentage of members above the 10-day reversal model, which identifies when the number of members trading above the 10-day moving average cycles from oversold to overbought in a short period of time.

The number of S&P 500 members above the 10-day moving average increased from 5% to 89% in only 5 sessions. That's the quickest reversal since last October.

S&P 500 members above their 10-day average generated a buy signal

This signal triggered 52 other times over the past 93 years. After the others, future returns and win rates were solid across all time frames.

Stat box

Despite a down day in stocks on Thursday, traders plowed more than $4.45 billion into the SPY fund, apparently betting on a rebound in the S&P 500. That was the 5th-largest inflow for the fund in the past year.


Corn's Santa Claus rally

Jay looked at the annual seasonal trend for corn futures, which is presently entering a favorable seasonal period.

For this test, we will examine the performance of corn futures between an upcoming 14-day stretch. The chart below displays the cumulative hypothetical $ + (-) achieved by holding a long 1-lot position in corn futures ONLY during this period every year starting in 1960.

The growth of $1 investing in corn only during a seasonally favorable period

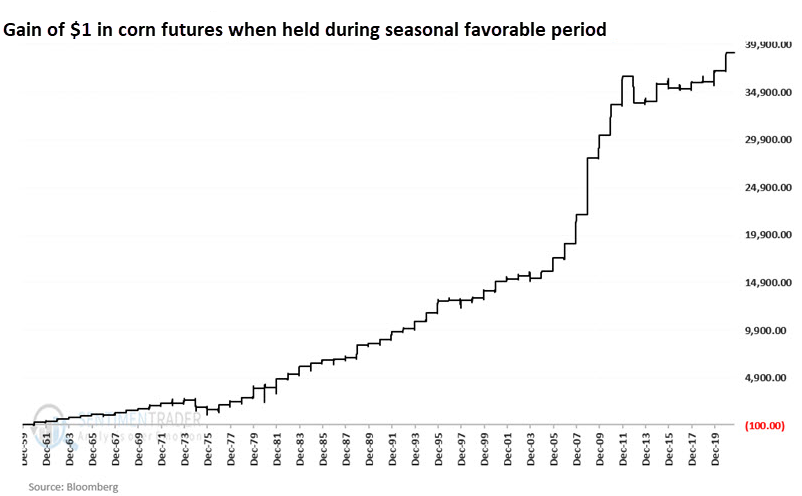
Over the past 61 years, 54 of them showed a gain during these roughly 3-week stretches with an average gain that was more than double the average loss.

South Korean stocks have been hit hard

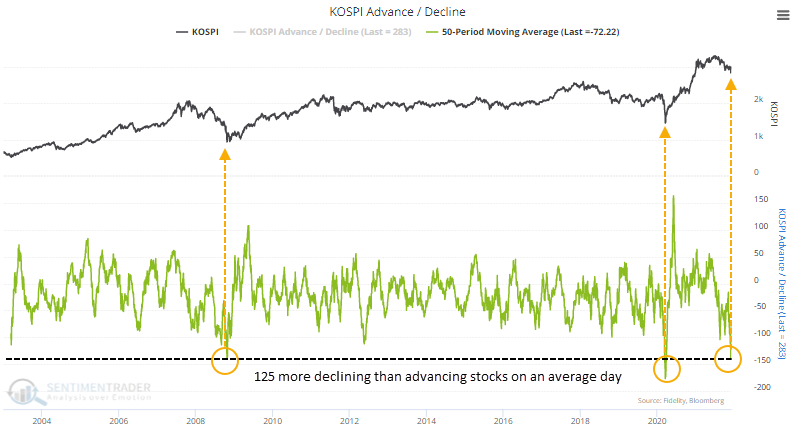
South Korean stocks have been hammered since their summer peak. In U.S. dollar terms, the Kospi dropped more than 18% before a strong rebound in recent days. The combination of rising Covid cases and a tightening central bank hasn't gone over well.

Damage has been widespread, as we can see with the advance/decline figures. On an average day heading into December, 125 more stocks declined than advanced. Only the global financial crisis and the pandemic panic can match this.

The South Korean Kospi index breadth is oversold

Other long-term breadth measures are showing a similar pattern. And there is evidence that U.S. based investors have fled the most popular fund that tracks these stocks.

DATA &
TECHnologies
IndicatorEdge
‍
BackTestEdge
‍
Other Tools
‍
DataEdge API
RESEARCH
reports
Research Solution
‍
Reports Library
‍
actionable
Strategies
Trading Strategies
‍
Smart Stock Scanner
‍
FREE
RESOUrCES
Simple Backtest
Calculator
Simple Seasonality
Calculator
The Kelly Criterion
Calculator
Sentiment Geo Map
‍
Public Research Reports
‍
Free Webinar
COMPANY
‍
About
‍
Meet our Team
‍
In the News
‍
Testimonials
‍
Client Success Stories
Pricing
Bundle pricing
‍
Announcements
‍
FAQ
© 2024 Sundial Capital Research Inc. All rights reserved.
Setsail Marketing
TermsPrivacyAffiliate Program
Risk Disclosure: Futures and forex trading contains substantial risk and is not for every investor. An investor could potentially lose all or more than the initial investment. Risk capital is money that can be lost without jeopardizing ones’ financial security or life style. Only risk capital should be used for trading and only those with sufficient risk capital should consider trading. Past performance is not necessarily indicative of future results.

Hypothetical Performance Disclosure: Hypothetical performance results have many inherent limitations, some of which are described below. No representation is being made that any account will or is likely to achieve profits or losses similar to those shown; in fact, there are frequently sharp differences between hypothetical performance results and the actual results subsequently achieved by any particular trading program. One of the limitations of hypothetical performance results is that they are generally prepared with the benefit of hindsight. In addition, hypothetical trading does not involve financial risk, and no hypothetical trading record can completely account for the impact of financial risk of actual trading. for example, the ability to withstand losses or to adhere to a particular trading program in spite of trading losses are material points which can also adversely affect actual trading results. There are numerous other factors related to the markets in general or to the implementation of any specific trading program which cannot be fully accounted for in the preparation of hypothetical performance results and all which can adversely affect trading results.

Testimonial Disclosure: Testimonials appearing on this website may not be representative of other clients or customers and is not a guarantee of future performance or success.