A low dollar-risk options strategy for speculators
Key points:
- An ETF that tracks Bitcoin has settled into a narrow trading range
- At the same time, implied option volatility has collapsed
- This combination can set the stage for a low-dollar risk options trade
A few relevant thoughts first
I am entirely agnostic about cryptocurrency. While I feel it got overhyped in recent years, Bitcoin has previously bounced back from more than 80% drawdowns on four separate occasions. Most assets that experience a bubble have their moment in the sun, then the bubble pops, and then they are rarely heard from again. So, I still have an open mind that there may be a "there" regarding crypto.
The trade highlighted below is NOT a recommendation. Its purpose is to serve as an example of one lower dollar risk way to approach a highlighted speculative situation. Also, please note the phrase "low dollar risk," which is not to be confused with "low risk."
The example below has a high risk of a potential 100% loss of capital committed. If the security does not move in the hoped-for direction, the position will expire worthless, resulting in a total loss of the premium paid. However, the actual dollar amount that a trader commits is very low on a 1-lot basis.
The strategy we will highlight is referred to as an out-of-the-money call calendar spread.
The setup
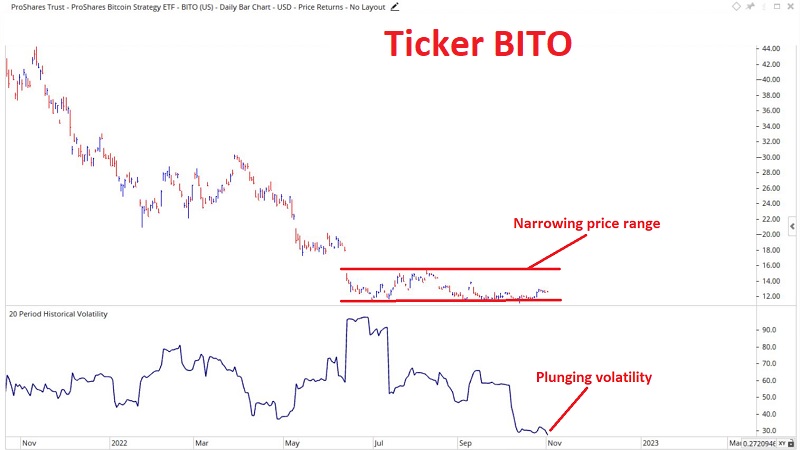
The chart below displays a daily chart for ProShares Bitcoin Strategy ETF (BITO). Note that after considerable volatility, the ETF has now settled into a very narrow range and that historical volatility has plunged. Low-volatility periods are usually followed by a significant move

The chart below also shows a bar chart for BITO along with the implied volatility (IV) for options on BITO (black line). Note that IV has plunged. The implications of this are that the time premium built into BITO options is very low, suggesting that options are "cheap" and that a subsequent increase in IV will inflate the price of BITO options.
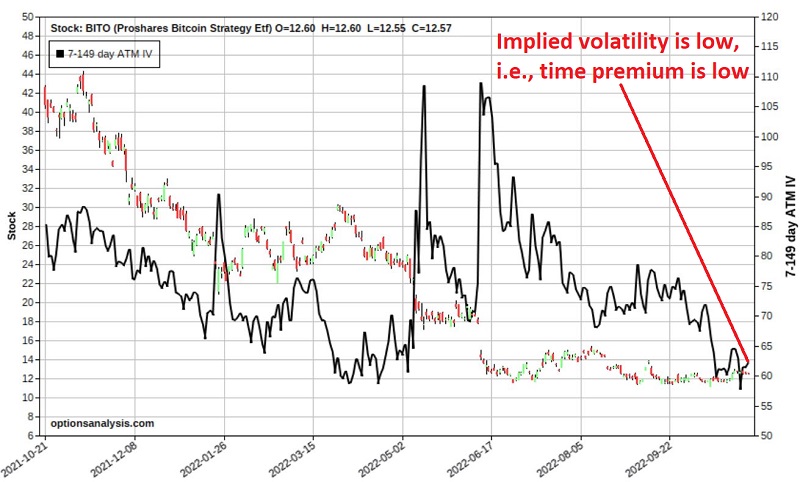
The hope is that BITO will make a meaningful price movement, IV will increase, and BITO shares will pop back up towards $15 a share between now and the end of the year. In addition, an increase in volatility along the way would also be welcome.
A strategy to take advantage
For our example trade, we will use a strategy known as an out-of-the-money call calendar spread, with the hope that BITO will move higher in price. Note that a trader who expects another price breakdown could just as easily use a put calendar spread to take advantage of that possibility.
Our example trade is as follows:
- Buy 1 BITO Mar17 2023 15 call @ $1.11
- Sell 1 BITO Dec30 2022 15 call @ $0.45
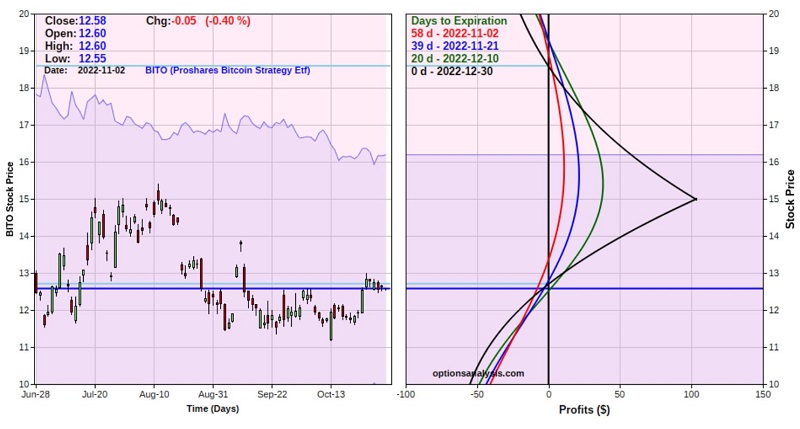
The particulars for this position and the risk curves are below. It shows the expected P/L as of a given price for BITO on four different dates through the Dec30 option expiration.

Key things to note:
- The cost to enter a 1-lot is $66. This represents the maximum risk in the trade
- The Vega is $1.25. This means that for each entire percentage point of rise in implied volatility, this trade will gain $1.25, based solely on the increase in time premium (likewise, a 1-point decline in IV will cause this trade to lose $1.25. So clearly, this position is a bet on higher IV)
- The theta is $0.24. This means that this position will gain $0.24 with the passage of one day due solely to time decay (because the Dec30 option will lose time premium more quickly than the Mar17 2023 option)
- The expected breakeven prices are $12.70 and $18.60. Within that range, we would expect a profit, and outside of that range, we would expect a loss
- The ideal scenario would be for BITO to drift higher toward $15 a share between now and the year-end. An increase in IV would also be beneficial, as we will see later
Managing the trade
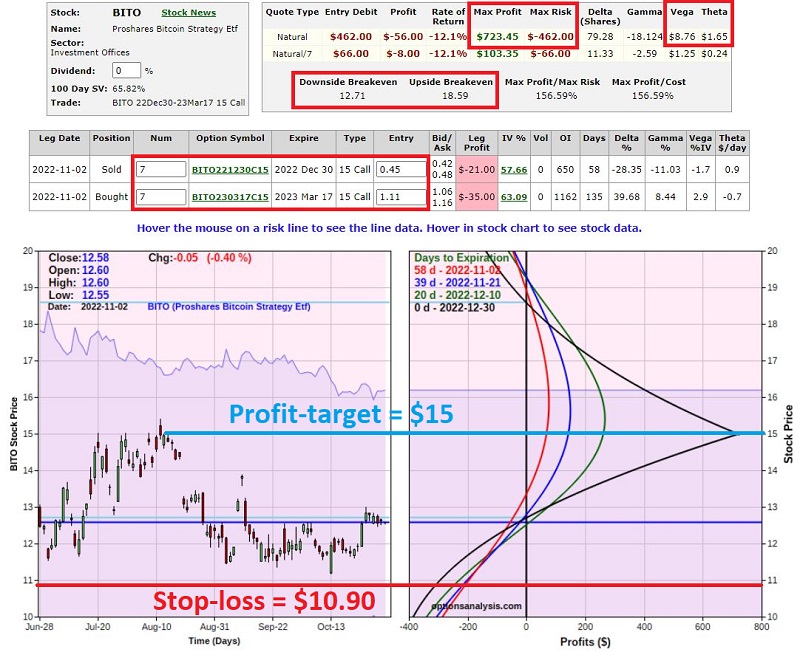
Let's assume that a trader with a $25K account decides to risk 2% of their capital on this trade. $25K x .02 = $500. So, the trader could trade a 7-lot for $462, as shown in the updated figures below.
There are no "one size fits all" rules for managing a calendar spread. But in this example, it is pretty reasonable to target the recent low ($11.18) as a stop-loss area and the strike price of $15 as a profit-taking point.
Profit-taking: We will exit this trade if BITO approaches $15 a share. The amount of available profit will depend on how long it takes to get there and any changes in implied volatility. If we look at where the four colored risk curve lines cross $15 a share in the chart above, we find that if BITO hits $15:
- Immediately (red line): Profit = +$70
- By 11/21 (blue line: Profit = $145
- Buy 12/10 (green line): Profit = $264
- On 12/30 (black line): Profit = $723
Cutting a loss: If the price does not reach $15, one choice is to hold the trade until expiration, knowing that the worst case is a loss of -$462. However, cutting a loss and harvesting any remaining premium may also make sense if the price breaks below the recent low. If we set a stop-loss level of $10.90 a share, then if BITO hits that price:
- Immediately (red line): Loss = (-$199)
- By 11/21 (blue line: Loss = (-$208)
- Buy 12/10 (green line): Loss = (-$240)
- On 12/30 (black line): Loss = (-$300)
How changes in implied volatility may affect this trade
Longer-term options are more sensitive to changes in IV than shorter-term options as they have higher Vega. So, if IV rises after this trade is entered, the long March 2023 call will gain more value than the short December 2022 call, and the overall position value will increase.
Let's assume that overall, IV rises by 25% from current levels. The result will be to shift the risk curves to higher ground (because the March 2023 calls that we are long will gain more than the December calls that we are short). The chart below displays the expected risk curves if IV increases by a factor of 1.25.
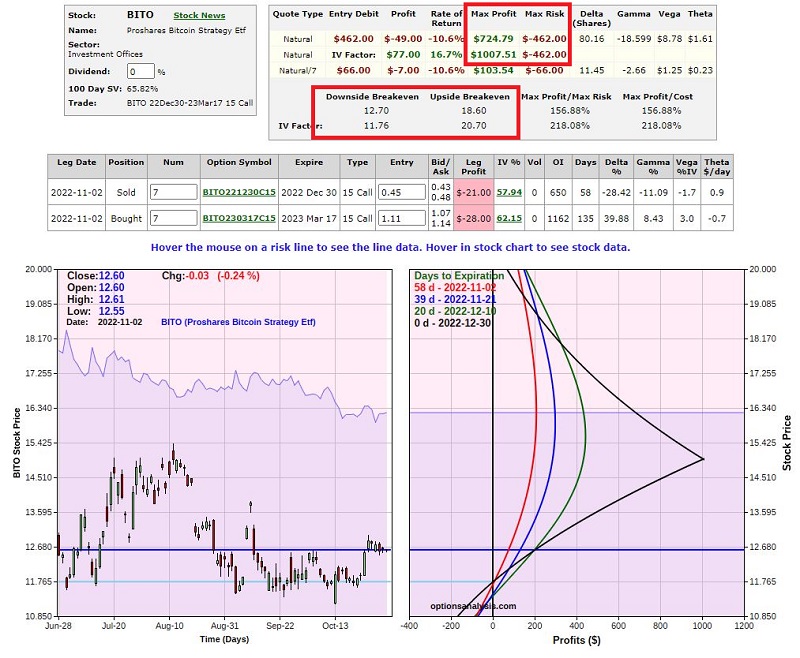
Note in the chart above that if IV increases by 25%:
- The maximum profit increases to $1,008
- The profit range expands from $12.70 and $18.60 to $11.76 and $20.70
Our profit target is still $15 a share; however, the expected return increases as follows:
- Immediately (red line): Profit increases from +$70 to $194
- By 11/21 (blue line: Profit increases from +$145 to $286
- Buy 12/10 (green line): Profit increases from +$264 to $433
- On 12/30 (black line): Profit increases from +$723 to $1,008
What the research tells us…
In a low-volatility situation, a call (or put) calendar spread offers a way to create a position that can profit if a) the price moves in the anticipated direction and/or b) implied options volatility rises after the position is entered. That said, traders must recognize that a 100% loss of the premium paid can be lost, so the position should be sized conservatively relative to account capital.


