
A long-term trend change for commodities

Key points:
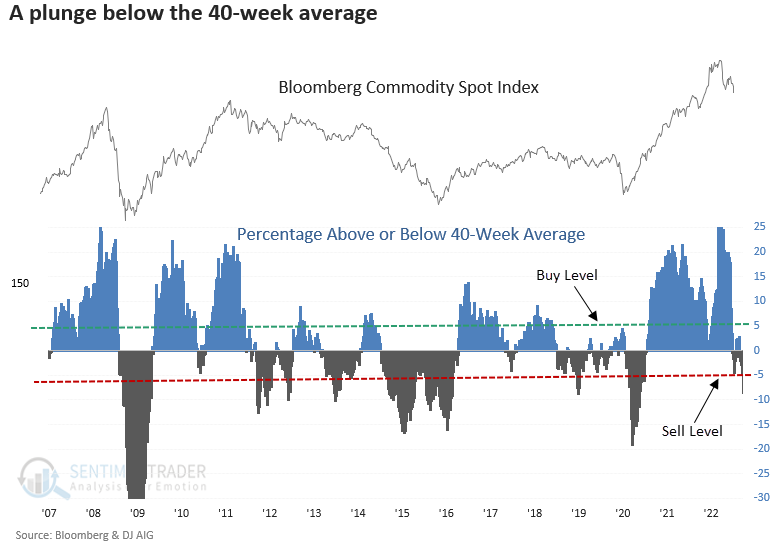
- The Bloomberg Commodity Spot Index fell 5% below its 40-week average
- With the deviation below the average, a long-term trend model for the index turned bearish
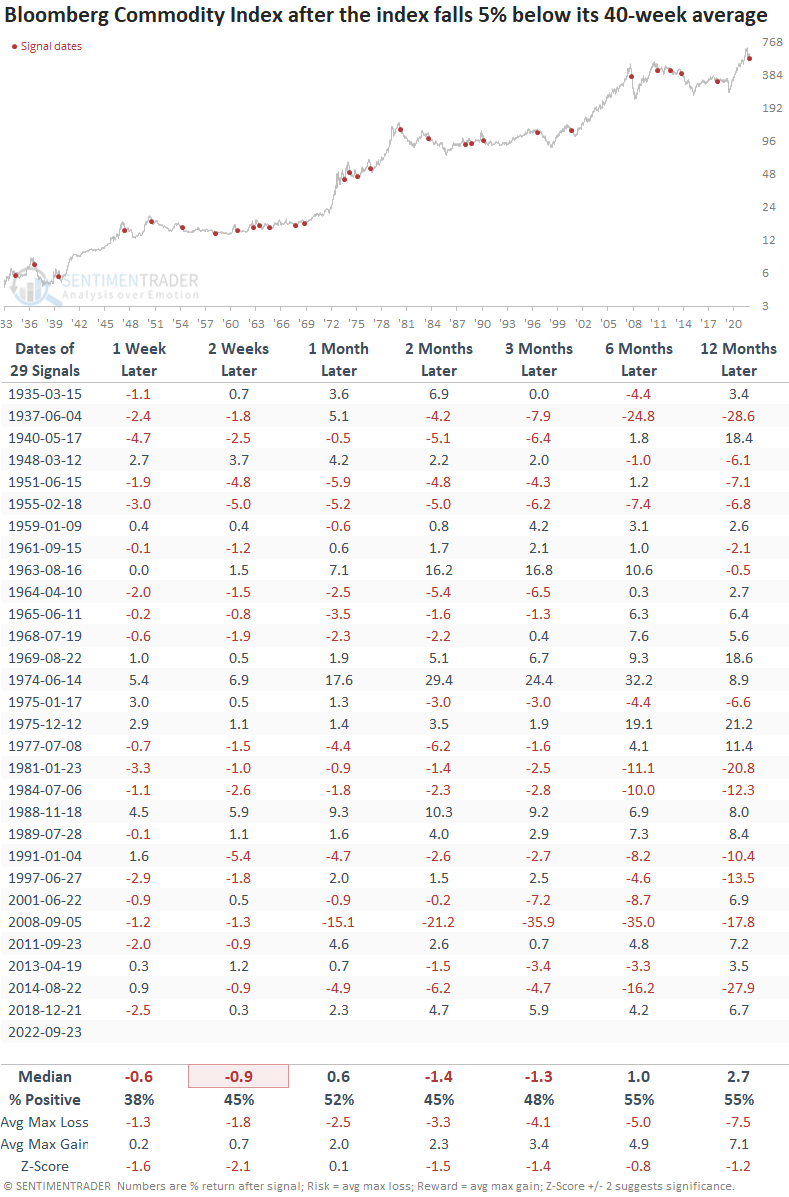
- After similar trend changes, a general basket of commodities struggled across most time frames
A bullish to a bearish reversal in long-term commodity uptrends
Commodities, like most assets, hit a rough patch last week. The adverse price action pushed the Bloomberg Commodity Spot Index more than 5% below its 40-week average, triggering a sell signal.
The long-term moving average model for commodities is simple. You buy when the commodity index closes 5% above its 40-week average. Conversely, if the index closes 5% below its 40-week average, you sell commodities.
The price trend change at the index level now confirms the reversal in long-term uptrends from individual commodities, which I shared in a note last week.
Similar trend changes preceded flat to negative returns for commodities
A long-term trend change for a basket of commodities looks unfavorable across most time frames. The Bloomberg Commodity Spot Index was negative at some point in the first year in all but three cases.
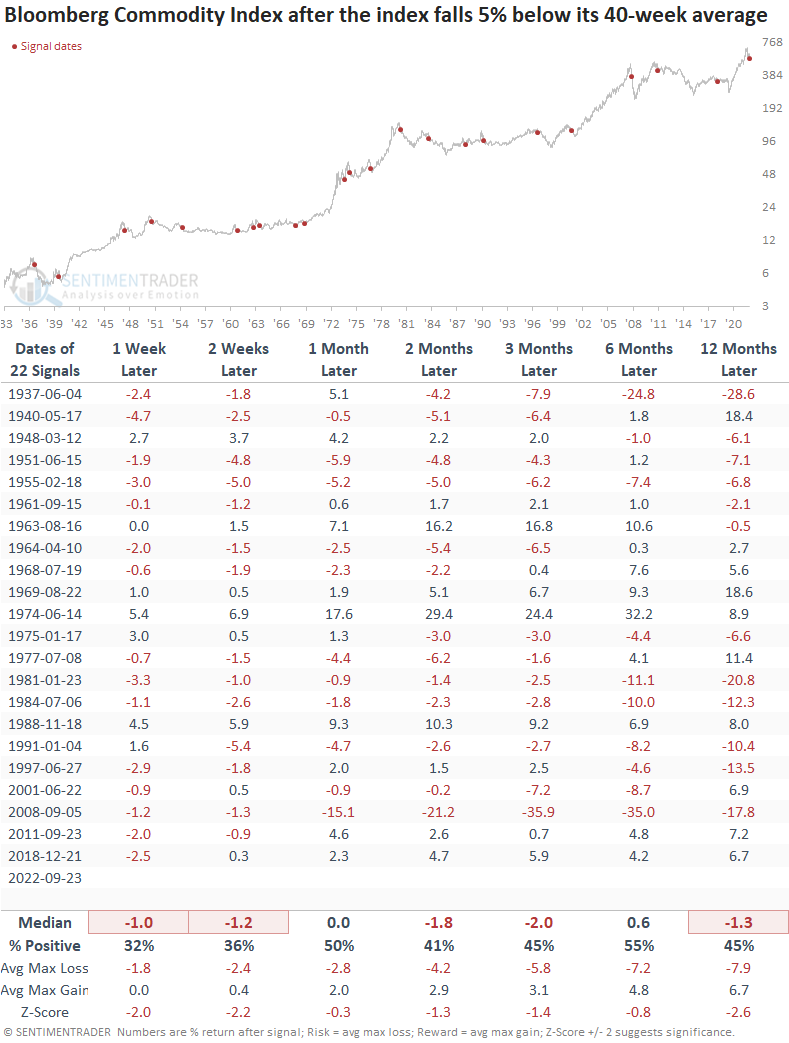
Context is important. So, let's isolate the first trend change signal after the commodity index registers a multi-year high, which is the case now. Results look worse across all time frames, especially a year later.
What the research tells us...
While commodities bucked the trend in the first six months of the year as stocks and bonds struggled, they are now completing significant trend change reversals. A simple long-term trend model that measures a deviation between price and its 40-week average shifted from a bullish to a bearish trend. After similar signals, the Bloomberg Commodity Spot Index struggled across most time frames, especially if the trend change occurred immediately after a multi-year high.