A Long-Term Perspective on PPI Inflation
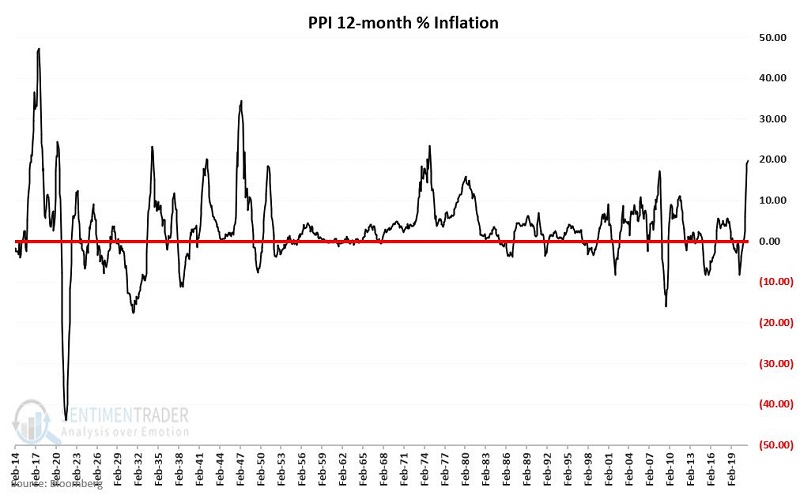
The latest Producer Price Index number just came out. And of course, it is getting spun in all different directions - based primarily on whether the person doing the spinning wants to spin it in a mostly negative light ("inflation is soaring!") or a mostly positive light ("the individual components are a mixed bag, therefore...").
Blah, blah, blah.
Here is what you need to know about inflation in general and the current way of things. It can be summed up very simply:
- Yes, inflation is presently "high" on a historical basis
- High OR inverse inflation (deflation) is typically bad for stocks (but - importantly - not always)
- Yes, the level of inflation does seem to matter (i.e., extreme readings are significantly worse than moderate readings)
In a nutshell:
- When inflation rises to a certain point, it is correct to be concerned about the impact on stocks
- HOWEVER, in each different circumstance, there is no guarantee that the market will decline solely because of high or rising inflation
THE PRODUCER PRICE INDEX (PPI) INFLATION RATE
For the record, let me tell you how I use PPI numbers. Monthly data can be downloaded here.
- The last date in the file currently reads 7/1/2021 - indicating that this is data for July 2021
- The data for one month is reported during the next month (i.e., the July 2021 value was reported on 8/12/2021)
- I wait until the end of the month to evaluate the data and assess the implications for the following month
At the end of each month, I divide:
- The latest value for the Producer Price Index
- By the value for the Producer Price Index from 12 months ago
- To calculate the percentage change over the past 12 months
This may differ from how many services report it because I see different sources report different "PPI inflation rate" numbers.
By this method:
- On 8/12, the July 2021 PPI value was reported as 231.20
- The July 2020 PPI value was 193.00
- So, at the end of August 2021, I will jot down a 12-month % change for PPI as 19.79%
The historical chart using this calculation since 1914 appears below.

The bottom line is that - however you calculate it - PPI inflation rises and falls over time, sometimes reaching extreme highs and lows.
Now let's examine if this has any impact on stocks.
THE STOCK MARKET AND PPI DEFLATION
First, note that the worst thing is NOT high and/or rising inflation. The worst thing is deflation, i.e., a meaningful decline in prices. This is what happened in the 1930s and basically results in an economy that may slow to the point of collapse.
In simplistic terms, it works like this:
- As prices decline, buyers put off purchases in hopes of buying later at a lower price
- Due to the decrease in demand, producers produce less supply
- As producers scale back their operation, the economy slows more, more people become unemployed, have less money to spend, and demand declines even more
- And so forth, as the economy essentially collapses on itself
There have been only a handful of times when PPI inflation has dropped to -12% or below. The chart below displays the cumulative % + (-) achieved by the Dow Jones Industrial Average if held only during those months when PPI inflation stood at -12% or less at the end of the previous month.
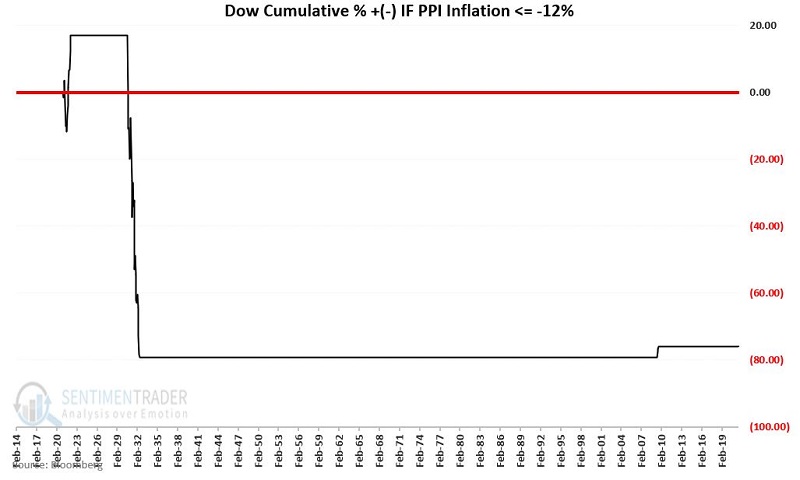
The bad news is that the above is a hideous picture. The good news is that it does not often happen - with virtually all of the major damage done between 1930 and 1932. Now let's look at bouts of PPI inflation.
THE STOCK MARKET AND PPI INFLATION
Generally speaking, inflation becomes a concern when it reaches and exceeds +4% on a 12-month basis. Why +4%?
To illustrate, let first start with +3%.
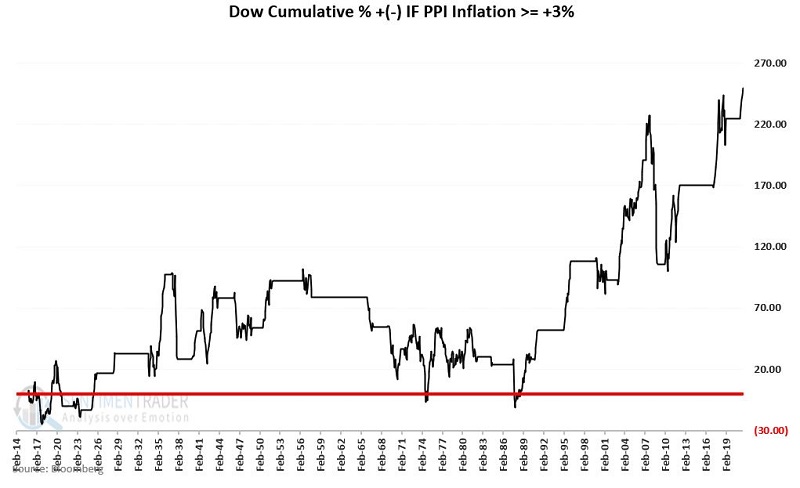
The chart below displays the cumulative % +(-) for the Dow since 1914 if held ONLY when PPI inflation at the end of the previous month is greater than +3%. As you can see, there is a lot of choppiness and plenty of downside volatility. But the overall result is still a gain of +249.4%.
Now let's change the cutoff to +4%. In other words, we will eliminate all months with PPI inflation between +3% and +4%.
The chart below displays the cumulative % +(-) for the Dow since 1914 if held only when PPI inflation at the end of the previous month is greater than +4%. As you can see, the cumulative result is now negative. In other words, holding the Dow over the last 107 years ONLY when PPI 12-month inflation is greater than 4% produced a loss of -3%.
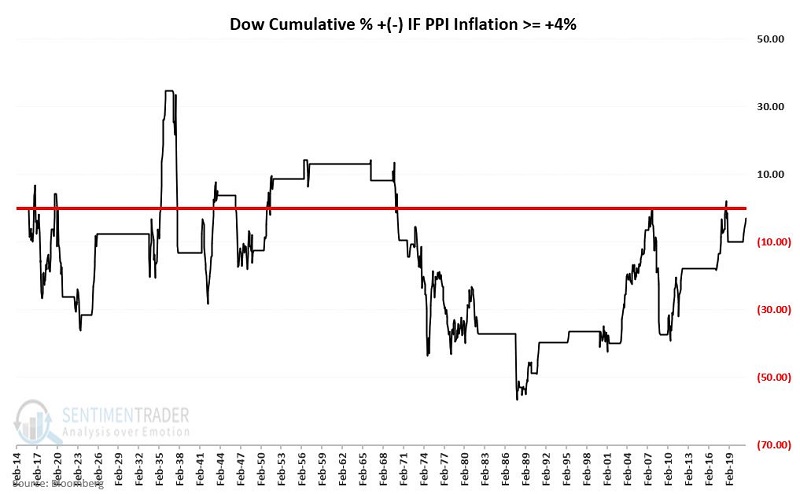
To put this -3% loss for the Dow into perspective, note that from February 1914 through July 2021, the Dow gained +57,875% (price only).
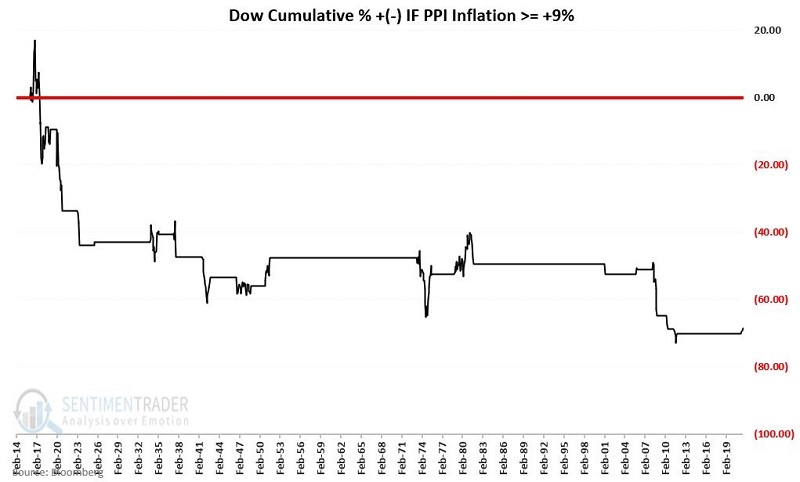
Now let's change the cutoff to PPI Inflation of +9%.
The chart below displays the cumulative % +(-) for the Dow since 1914 if held ONLY when PPI inflation at the end of the previous month is greater than +9%. As you can see, the cumulative result is now extremely negative.
- In other words, holding the Dow over the last 107 years ONLY when PPI 12-month inflation is greater than +9% produced a staggering loss of -68.7%
SUMMARY
Using the simple calculation method, I described earlier:
- The current PPI inflation rate is +19.79%
- Since +19.79% is greater than +9%, the implication from the chart above is that this is negative for stocks
That said:
- We can note in the chart above that NOT ALL periods of >+9% PPI inflation resulted in severe stock market declines
- The PPI inflation rate first pierced +9% in the latest go-round at the end of April 2021
- Since that time, the Dow has barely shrugged, walking steadily higher by roughly +4.8%
So does this mean that we don't need to be concerned about high inflation this time around?
The jury is still out on that one.
The bottom line is that - based on historical results - the current state of inflation should be listed on the negative side of the "Weight of the Evidence" ledger.

