
A Logical Bond Market Experiment (That Just Might Work)

Inflation is an enemy of the bond market. When a bond buyer buys a bond, they typically lock in a rate of return based on the amount of interest the bond pays annually. If inflation rises while that bond is held, the purchasing power of the future interest payments is reduced, as is the value of that bond.
One potential exception is TIPS bonds (Treasury-Inflation Protected Securities). In short, the principal value of a TIPs bond is reset every six months based on changes in the Consumer Price Index, and interest is paid based on that adjusted principal value. So, if inflation soars during the life of a particular TIPs bond, the amount of interest paid to the bondholders is increased. This increase in interest paid helps offset some or all of the purchasing power lost to inflation.
If you want more information on the nitty-gritty of TIPs, I suggest Google and/or this helpful primer.
The purpose of this piece is not to argue the pros and cons of TIPs. The purpose of this piece is to test a theory and one specific approach in attempting to maximize bond returns regardless of inflation.
THE DATA
For our initial test, we will use total return data for:
- Ticker IEF ( iShares 7-10 Year Treasury Bond ETF )
- Ticker STIP (iShares 0-5 Year TIPS Bond ETF)
The data measures we will use as indicators are:
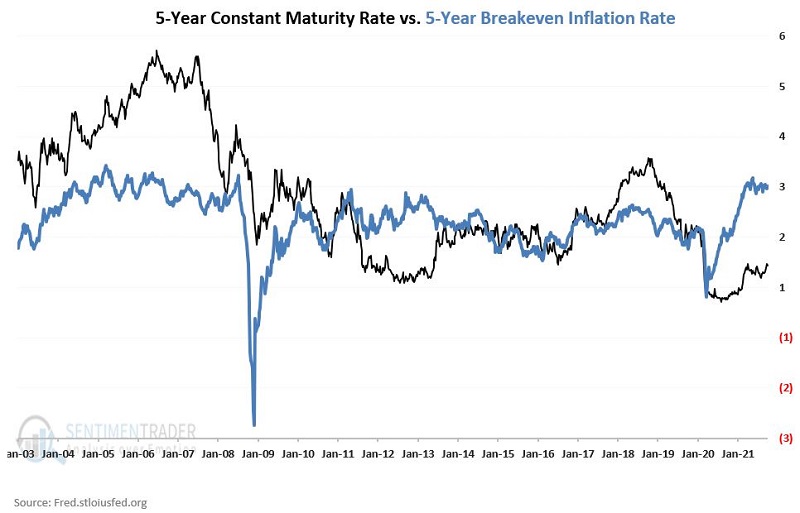
- A = 5-Year Treasury Constant Maturity Rate: The yield on a 5-year treasury security (analyzed at the end of each week)
- B = 5-Year Breakeven Inflation Rate: The difference between the 5-Year Treasury Constant Maturity Rate and the yield on inflation-protected security with 5-years remaining to maturity (analyzed at the end of each week)
- C = (A - B)
The chart below displays Variables A and B.
The chart below shows the difference between the two lines in the chart above and plots Variable C.
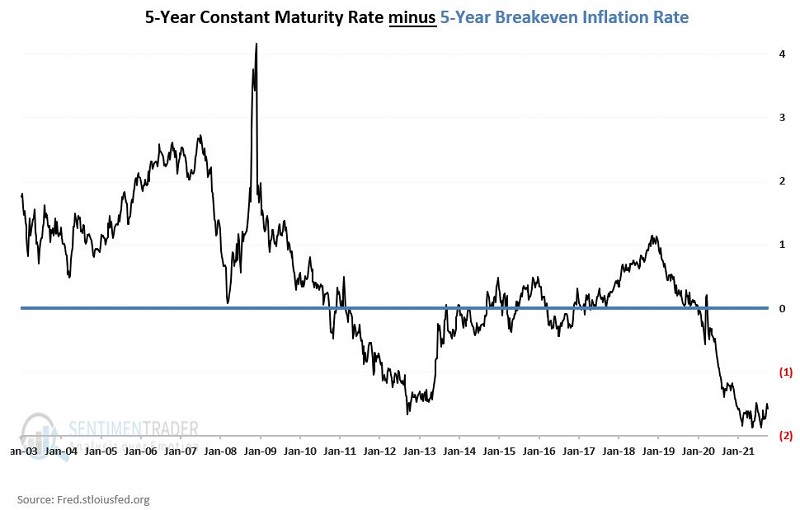
The bottom line is pretty straightforward: Sometimes the Constant Maturity Rate is higher, and sometimes the Breakeven Inflation Rate is higher (i.e., sometimes Variable C is positive, and sometimes it's negative). So, one question I asked was, "does it make any difference to bond prices?"
In theory, straight treasuries are more attractive when Variable C is positive, and TIPs are more attractive when Variable C is negative. So the other question I asked was, "does this logical theory hold water?"
THE TEST
For the sake of testing, we will set our "cutoff" at 0.1 for our Indicator (Variable C). In other words:
- If (the 5-Year Constant Maturity Rate minus the 5-Year Breakeven Inflation Rate) is GREATER than 0.1, we will deem this as "Favorable"
- If (the 5-Year Constant Maturity Rate minus the 5-Year Breakeven Inflation Rate) is LESS than OR EQUAL to 0.1, we will deem this as "Unfavorable"
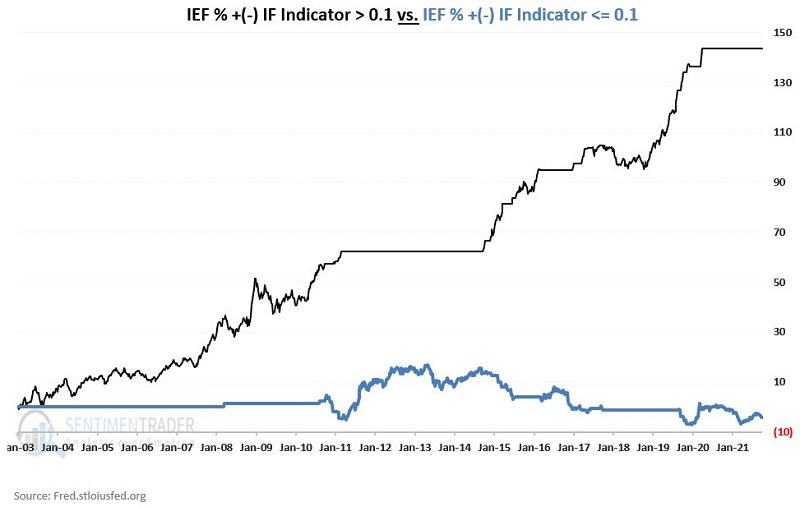
We will initially look at ticker IEF (which has total return data back to 2003). The chart below displays the results.
The table below summarizes the two sets of data.
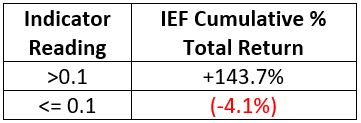
From January 2003 through 10/1/2021:
- Variable C was above 0.1 59.9% of the time and during that time gained 143.7%
- Variable C was at or below 0.1 40.1% of the time and during that time lost -4.1%
ADDING IN TIPS
For the next test, we will also consider total return data for ticker STIP starting the week ending 12/3/2010 (first week of available data).
We will test the following "Switching Strategy":
- IF Variable C > 0.1 THEN hold IEF
- IF Variable C<= 0.1 THEN hold STIP
We will also compare the return to buying and holding ticker IEF. The chart below displays the comparative results.
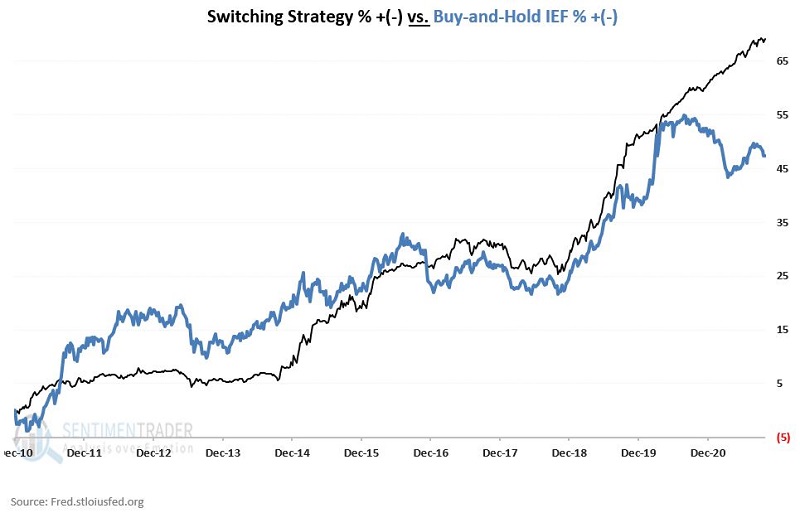
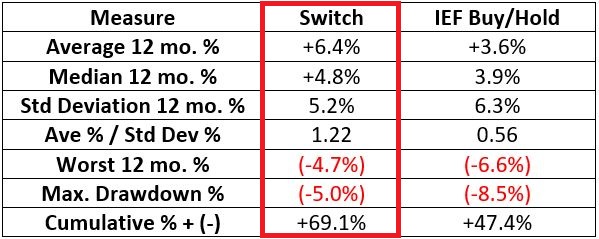
The table below summarizes the performance numerically
SUMMARY
This little experiment is by no means the "be all, end all" of investment strategies. Likewise, a 10-year test may not capture all environments that a bond strategy might encounter over time.
Still, compared to buying-and-holding IEF, the "Switch Strategy" did achieve:
- Higher returns
- More consistently
- With less volatility
- With lower drawdowns
The relative merits of this one example strategy aside, the real bottom line is that bond investors may be wise to watch interest rates versus the inflation rate breakeven price.