
A little-known signal from the Smart Money /Dumb Money Spread

Key points
- Our Smart Money / Dumb Money Confidence Spread Index is designed to highlight extremes in investor sentiment
- A long-term moving average of this index can also help to identify times when "the tide has turned"
- This article looks at the 200-day average of the index to identify potentially favorable periods for stocks
More than one way to skin a cat
We generally look for extremes in the Smart Money / Dumb Money Confidence Spread Index to highlight and identify when the trend favors a shift based on too much bullish or bearishness. But there are other applications. And as is often the case, the simpler, the better.
For this piece, we will highlight those occasions when the 200-day average of the Smart Money / Dumb Money Confidence Spread Index crosses below .09 (technically, we use 0.089 in the Backtest Engine). In the past 20+ years, this occurrence has tended to mark confirmation that the worst is over.
The chart below shows that spikes in the Smart Money / Dumb Money Confidence Spread Index tend to accompany market lows (as Dumb Money gets too bearish relative to Smart Money). You will also note that sometimes these events mark significant lows in the market and are followed by longer-term rallies. You may also notice that on other occasions, the relief rally may be short-lived (this is more common during more drawn-out bear markets such as 2000-2002, 2008, and 2022(.
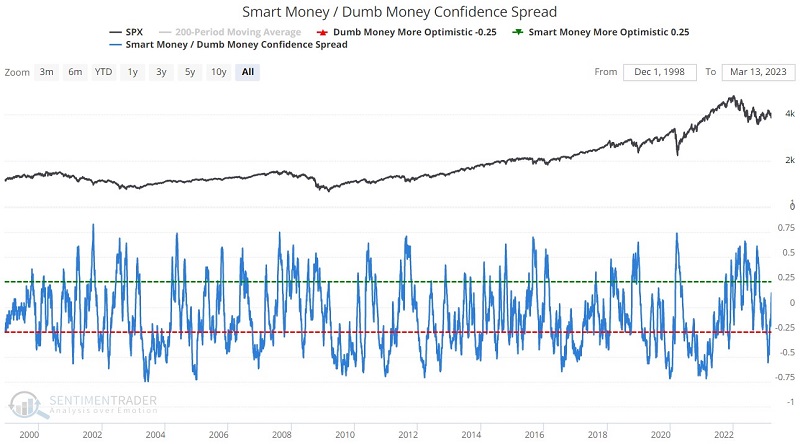
A reading above 0.25 suggests that bearish sentiment is getting overdone and that a rebound rally is becoming more likely. The one thing it does not tell you is how long that rebound rally will last.
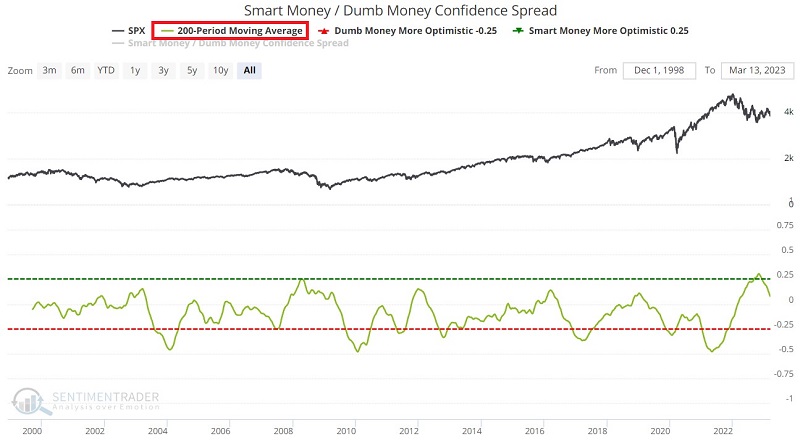
The chart below displays the S&P 500 Index along with the 200-day moving average of the squiggly blue line in the chart above. Peaks in this green line tend to occur after the stock market has bottomed.
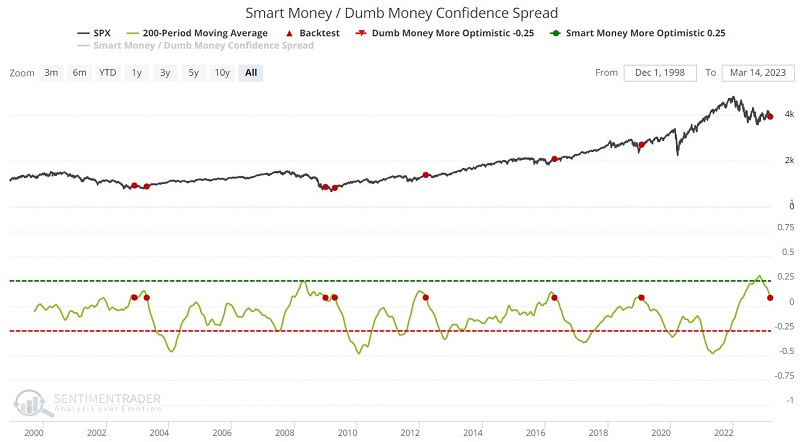
Now to go one step further (in attempting to establish an "All Clear" benchmark), instead of giving a signal as soon as the green line rolls over from a peak, the chart below highlights those occasions when the 200-day average of the raw indicator crossed below 0.09. Red dots mark those relatively rare occasions.
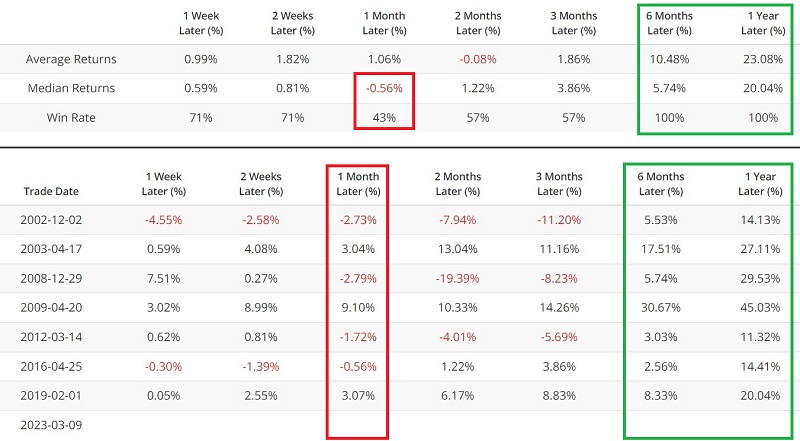
The table below summarizes the performance following the dates highlighted by the red dots in the chart above. On the plus side, results were positive 100% of the time six and twelve months later. On the other hand, the S&P 500 showed a gain one month after a signal less than 50% of the time. 2002, 2008, and 2012 signals were also significantly negative three months after the signal.
A closer look at performance results
The chart below displays the cumulative growth of $1 invested in the S&P 500 Index (using total return data) if held for twelve months after each signal date listed in the table above. If a new signal occurs within twelve months of the previous signal (this happened twice), the holding period is extended for another twelve months from the date of the second signal.
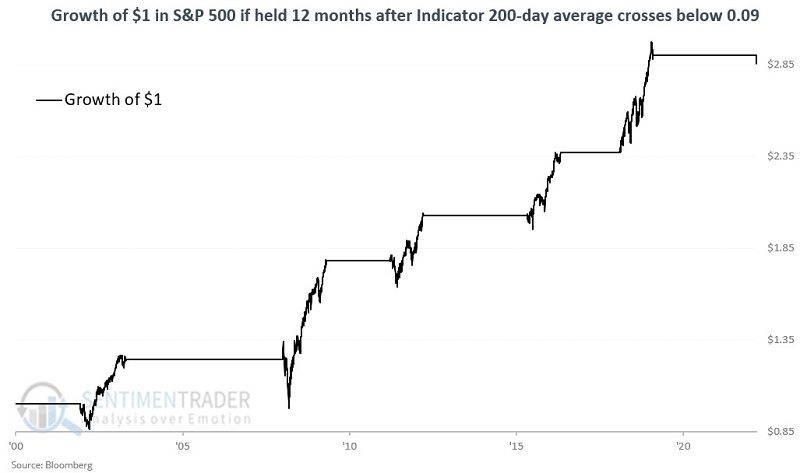
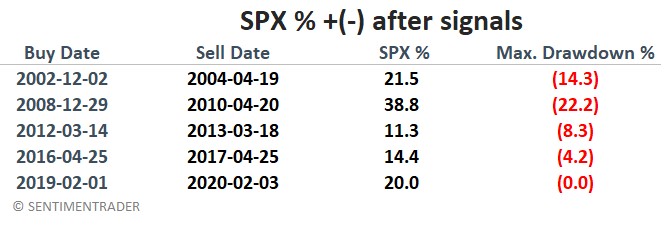
Because two of the seven signal dates occurred within twelve months of a previous signal, only five bullish periods are shown in the chart above. The table below displays the performance of the S&P 500 during each of these periods. The "Maximum Drawdown %" column shows the largest percentage decline from the closing price for SPX on the date of entry.
What the research tells us…
The good news is that all signals previous to the March 2023 signal saw the S&P 500 advance in the year ahead. If history proves an accurate guide, the market will be higher by double digits a year from now. The bad news is that there is no guarantee that March 2023 signal will show similar results. Also, it may be a bridge too far to label the signal described above as an "all clear" signal. As shown in the tables above, the S&P showed a gain only 43% of the time one month after a signal, and there were some not-insignificant drawdowns within the holding periods.