
A key economic indicator gives a message that most get wrong

Key points
- The PMI Index (ISM Purchasing Manager's Index), or PMI for short, is a measure of economic strength
- PMI has declined in each of the last three months, generating the typical amount of hand-wringing and recession warnings
- However, too many forget that the stock market is a discounting mechanism, and that PMI is generally a contrarian indicator
The PMI Index overview
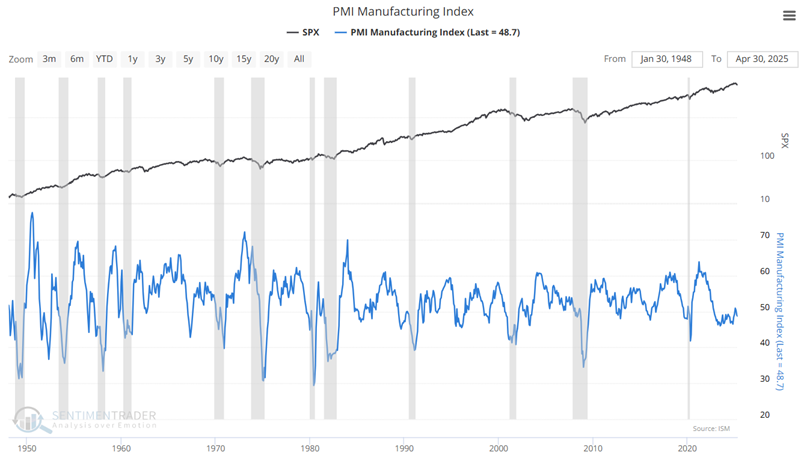
This indicator measures the ISM PMI Index. Note that troughs in the index tend to occur during economic recessions, which are highlighted in gray. As a result, most people automatically associate low and/or declining PMI readings with recession, i.e., as something "bad." But as we will soon see, they may be missing something important.
Per Investing.com:
The Institute of Supply Management (ISM) Manufacturing Purchasing Managers Index (PMI) Report on Business is based on data compiled from monthly replies to questions asked of purchasing and supply executives in over 400 industrial companies. For each of the indicators measured (New Orders, Backlog of Orders, New Export Orders, Imports, Production, Supplier Deliveries, Inventories, Customers Inventories, Employment, and Prices), this report shows the percentage reporting each response, the net difference between the number of responses in the positive economic direction and the negative economic direction and the diffusion index. Responses are raw data and are never changed.
The diffusion index includes the percent of positive responses plus one-half of those responding the same (considered positive). The resulting single index number is then seasonally adjusted to allow for the effects of repetitive intra-year variations resulting primarily from normal differences in weather conditions, various institutional arrangements, and differences attributable to non-moveable holidays. The U.S. Department of Commerce supplies all seasonal adjustment factors and is subject annually to relatively minor changes when conditions warrant them.
The PMI is a composite index based on the seasonally adjusted diffusion indices for five of the indicators with varying weights: New Orders --30% Production --25% Employment --20% Supplier Deliveries --15% and Inventories -- 10%.
As we will soon see, at the extremes, PMI is just another wayward sentiment tool. When the index falls sharply, particularly to a low level, the usual lamentations of "slowing growth, economic weakness, and impending recession" expand exponentially. And when PMI reaches a high level, the news trumpets strong growth and a booming economy.
Let's take a closer look.
PMI Index as it relates to the stock market
First, PMI should be used as a weight of the evidence item to gauge sentiment and not as a standalone trading model that generates automatic buy and sell signals.
Second, while PMI measures current trends in U.S. manufacturing, the stock market is a discounting mechanism that tends to look roughly 6-9 months down the road regarding the economy.
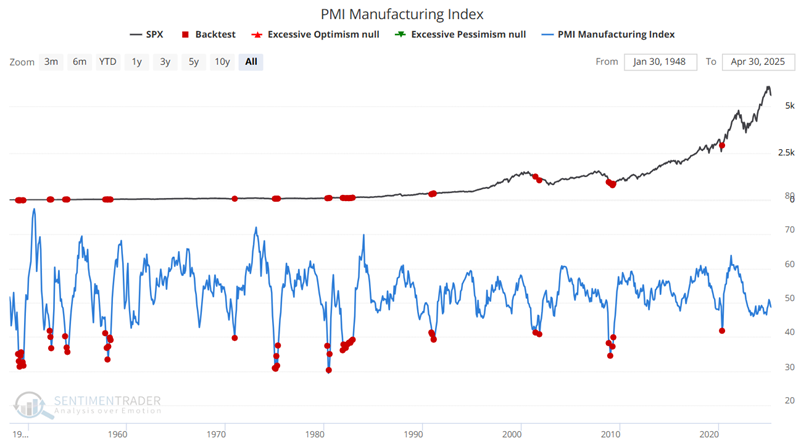
To understand the contrarian nature of PMI results, let's start with all readings below 50. The chart below highlights every month when PMI ended the month with a reading below 50.
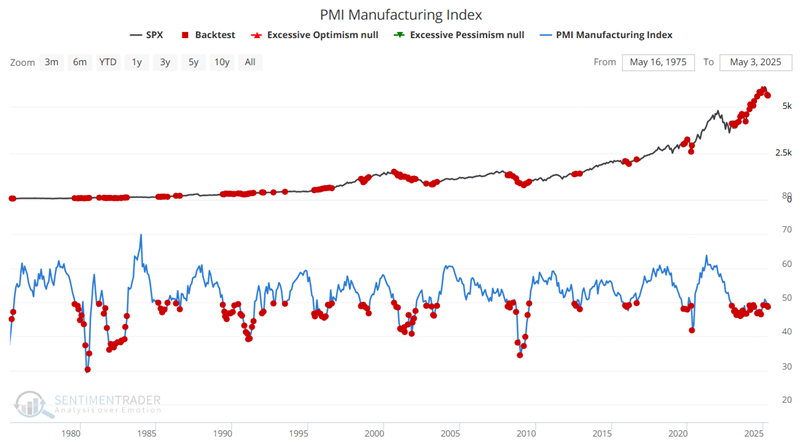
The table below summarizes subsequent SPX performance.
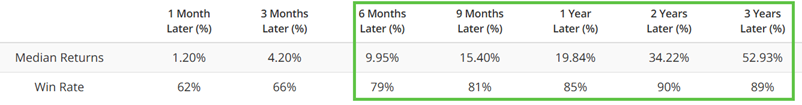
For reference, note that following these periods of supposedly "slow growth" and "economic contraction," the 1-Year Median Return and Win Rate are 19.84% and 85%, respectively.
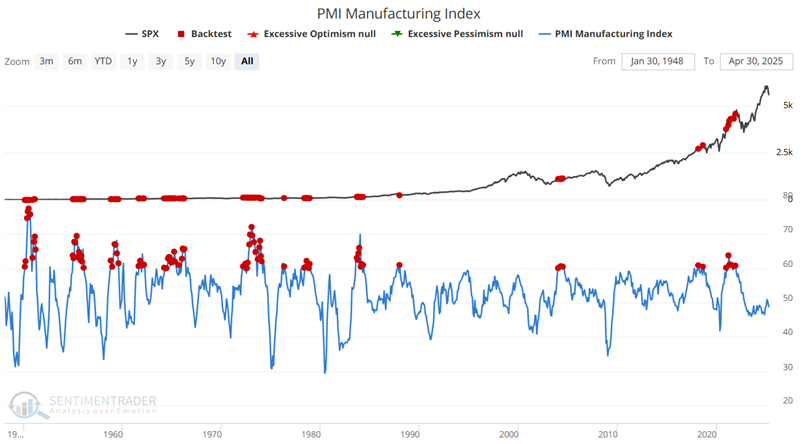
By comparison, the chart below highlights every month when the PMI ended the month with a reading above 50.
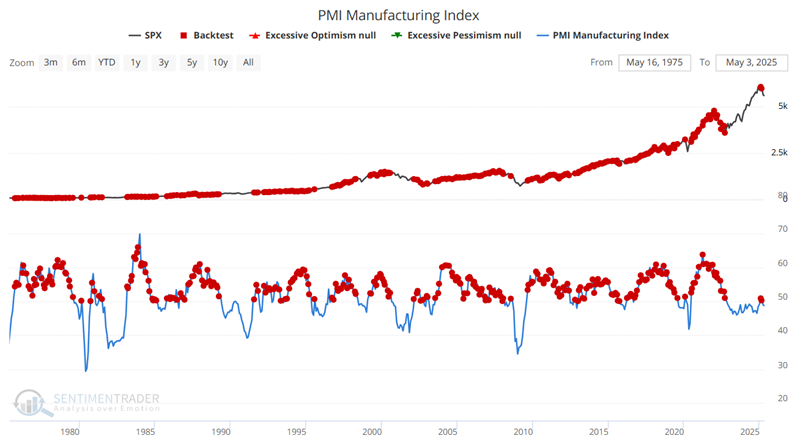
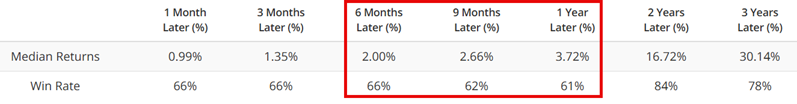
The table below summarizes subsequent SPX performance.
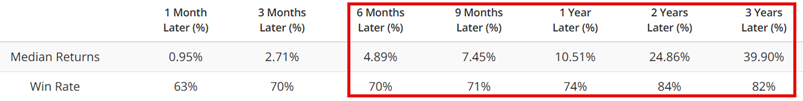
On one hand, the Win Rate for 1-month and 3-month periods is fractionally higher than following PMI readings below 50. On the other hand, every other value is lower than the table above for PMI readings below 50. For comparison, note that following these periods of supposedly "slow growth" and "economic contraction," the 1-Year Median Return and Win Rate are 10.51% and 74%, respectively (versus 19.84% and 84% from above when PMI was below 50).
Results are even more extreme at the extremes
When PMI crosses below 42, the headlines trumpet an economy "falling apart," and pessimism grows-at least for a while. Still, the chart below highlights every month when PMI ended below 42.
The tables below summarize subsequent SPX performance.
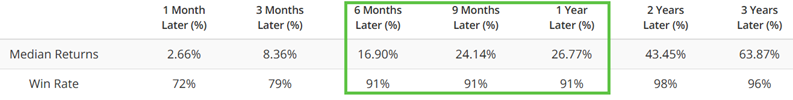
On the other end of the spectrum, the headlines are "sunshine and roses" when PMI hits 60 or higher ("Booming economy", etc.). However, the chart below highlights every month when PMI ended the month above 60.
The tables below summarize subsequent SPX performance.
What the research tells us…
It is often stated that the stock market is a "discounting mechanism." The results above strongly reinforce that assertion. The stock market tends to behave counterintuitively from what the majority of people would expect based on movements in and the absolute level of the PMI Index. The recent decline and relatively low reading for PMI should not be thought of as a "buy" signal. However, the real lesson is that it should also not be viewed as negatively as it is portrayed in the financial press.