
A Historic Surge in New Highs, and Reversals

On Friday, nearly a third of stocks in the S&P 500 managed to hit a 52-week high on that day alone. Then it skyrocketed to a stunning 78-year high on Monday.
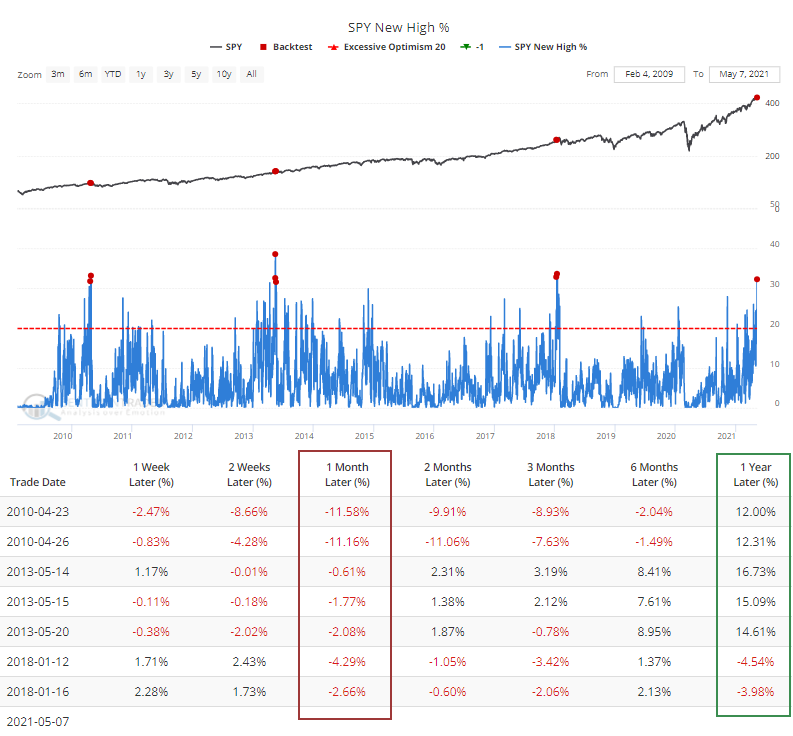
Even Friday's reading was so high that it had been matched by only 7 other days in more than 20 years, as we noted on Friday. The Backtest Engine shows how the index performed after the others.
Every one of the sessions preceded a loss over the next month, but those losses were front-loaded, and over the next 6-12 months, stocks rebounded.
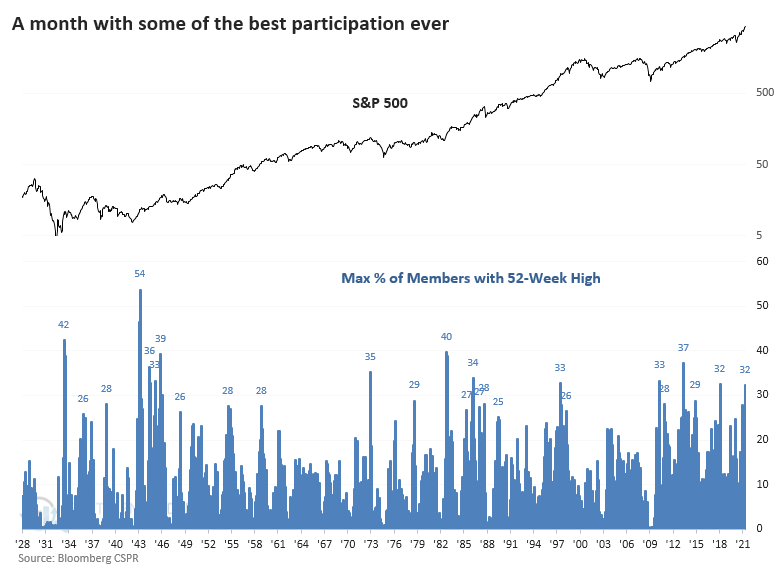
Dating back to 1928, this is among the months with the greatest participation ever, and that's before Monday's remarkable session.
If we look for times when the S&P strung together at least 5 straight months with an all-time high, and at least 20% of its members hit a 52-week high, we can get a sense of what happened after other bouts of extreme momentum + participation.
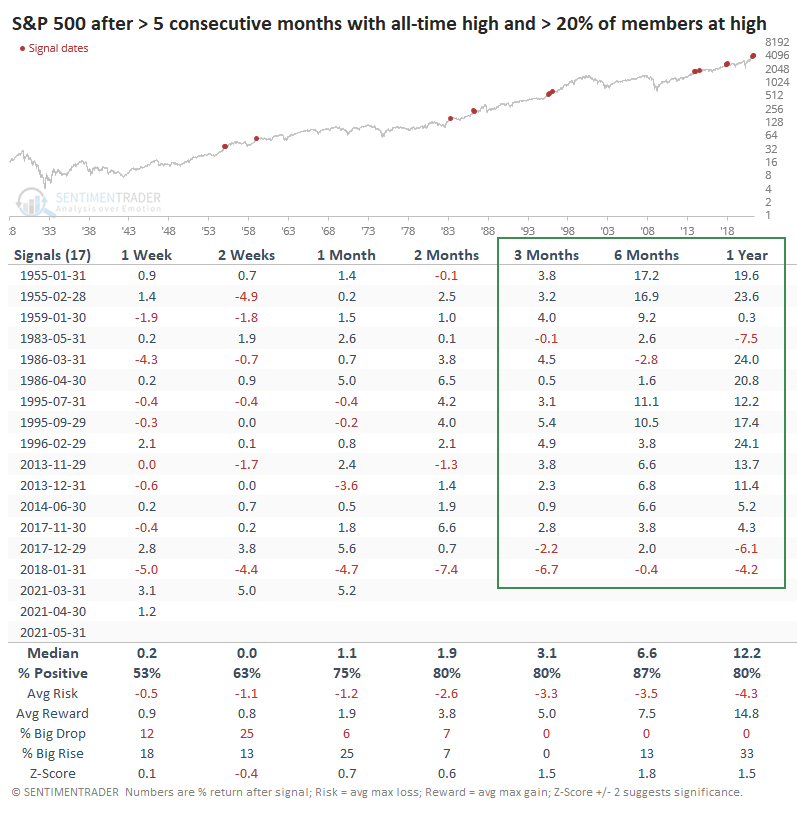
Shorter-term returns were fine, in line with random. The S&P typically rose, and losses were relatively small. The most impressive performance was over a medium- to long-term time frame, with only a few losses, and all under 7.5% across every time frame.
This confirms most of the other studies we've looked at lately, with impressive momentum and broad participation rarely preceding large, sustained losses and bear markets. The shorter term is more of an issue, though.
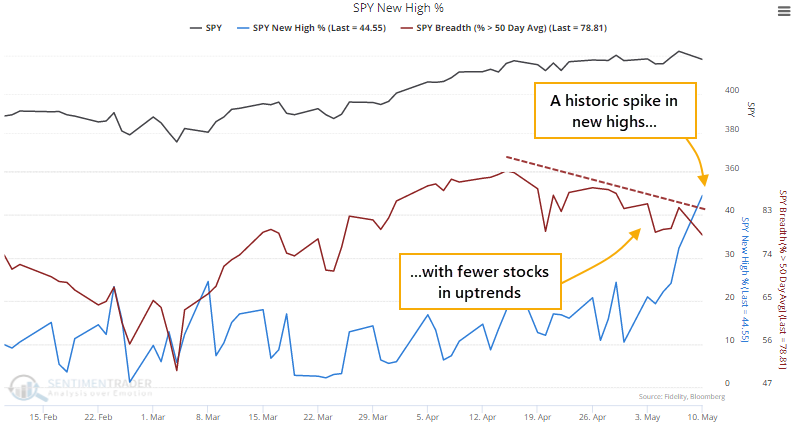
Monday was odd in many respects, not the least being another surge in stocks setting 52-week highs. More than 44% of S&P members notched a high in the morning, the most since 1943. Since 1928, there has only been a single day - January 16, 2018 - when more than 30% of stocks hit a 52-week high at the same time that fewer than 80% of them were trading above their 50-day moving averages.
This is exceptionally odd behavior.
The burst of gains and push to new highs early on Monday was reversed during the session, causing a spike in the number of stocks suffering a buying climax. This is triggered when a stock hits a 52-week high then reverses to close below the prior day's close, potentially a sign of exhaustion among buyers.
The Backtest Engine shows that this is the 6th-largest number of climaxes in a single day since the inception of SPY.
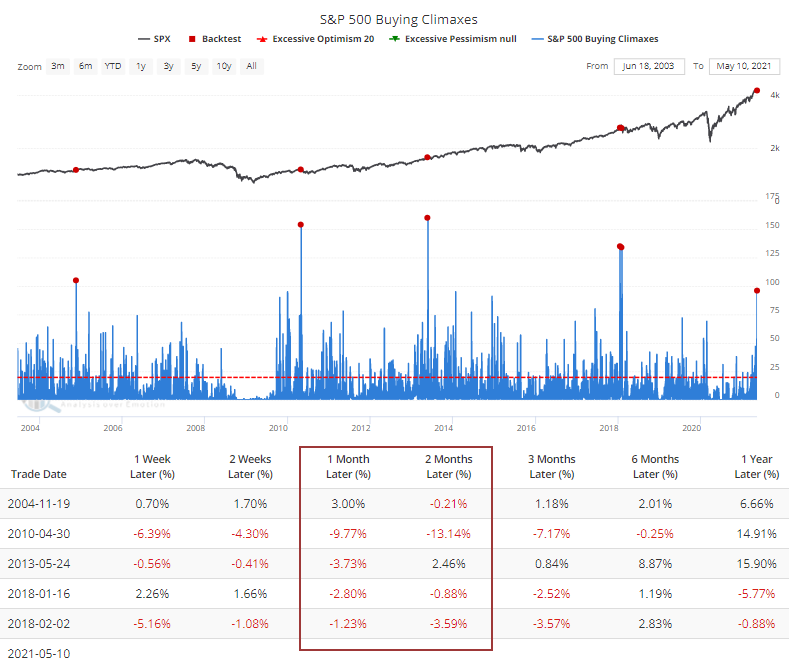
Every time more than 95 stocks suffered a buying climax, the S&P 500 showed a loss over the next 1-2 months. Again, though, there were few losses over the next 6-12 months, and they were relatively small.
Monday's session emphasized the high potential risk and low probable reward that buyers are facing right now. This is mostly a concern for those with a time frame of weeks, however. So far, the type of activity and behavior we've seen has typically preceded gains over longer time frames of 6-12 months.