A Historic Streak As Investors Wade In

This is an abridged version of our Daily Report.
A(nother) historic streak
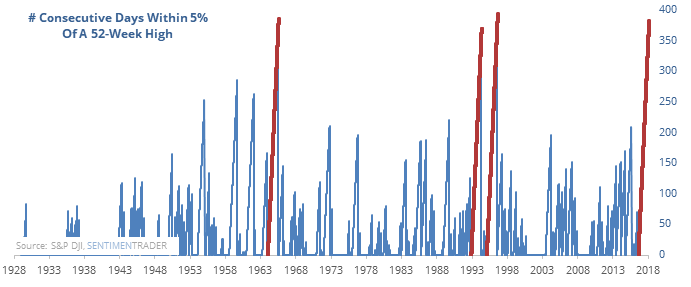
After setting so many different records last year, 2018 is on track to score even more. Among them, the major indexes haven’t been more than 5% from a 52-week high for nearly 400 days (more than 450 days if we exclude a single day last June).

There were 3 other time periods that matched what we’re seeing now, and after each of them, the S&P 500 declined more than 7% over a period of 30-40 days.
All in, part deux
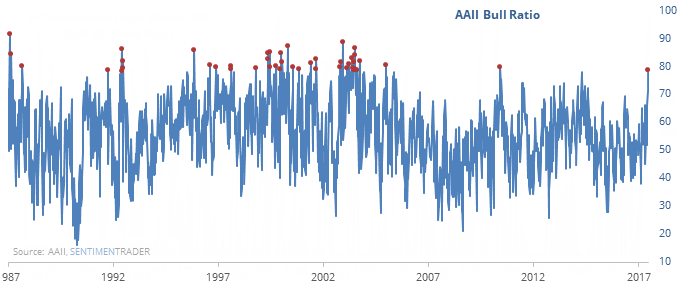
Individual investors have the most stock exposure since 2000, and their short-term optimism is now rising. It has done an about-face during the past two months, going from pessimism to the 2nd-highest optimism since the 2009 low.

The AAII Bull Ratio is nearly 80%, a level that has led to poor annualized returns. The times when it got this extreme with stocks at a high, future gains were erased.
Payroll report
The widely-watched Nonfarm Payroll report is on Friday. When the December report has been released (the first week in January), the S&P 500 has rallied over the next two weeks 40% of the time.
Rising risk
For stocks, the combined Short-Term Risk Level and Medium-Term Risk Level is 13.
For access to the full report, indicators, charts, screens, and Backtest Engine, log in or sign up for a free 30-day trial today.

