Data &
Technology
Research
Reports
Report Solutions
Reports Library
Actionable
Strategies
Free
Resources
Simple Backtest Calculator
Simple Seasonality Calculator
The Kelly Criterion Calculator
Sentiment Geo Map
Public Research Reports
Free Webinar
Pricing
Company
About
Meet Our Team
In the News
Testimonials
Client Success Stories
Contact
Log inLoginSign up
< BACK TO ALL REPORTS

A historic spread between Staples and everyone else

Jason Goepfert
2021-12-21
Almost all Consumer Staples stocks are above their 50-day moving averages, while few stocks on the Nasdaq exchange are. A simple strategy for Emerging Markets vs the S&P 500.

Staples vs. the Nasdaq

We've already seen that internal trends have been powerful in defensive sectors like Consumer Staples but curiously weak in higher-beta areas like the Nasdaq 100. It's even more fragile in the broader measures that look at the entire Nasdaq exchange.

The percentage of Staples stocks trading above their 50-day moving averages reached 90% last week, while fewer than 25% of stocks on the Nasdaq managed to hold their medium-term trends.

Staples above 50 day average versus Nasdaq stocks

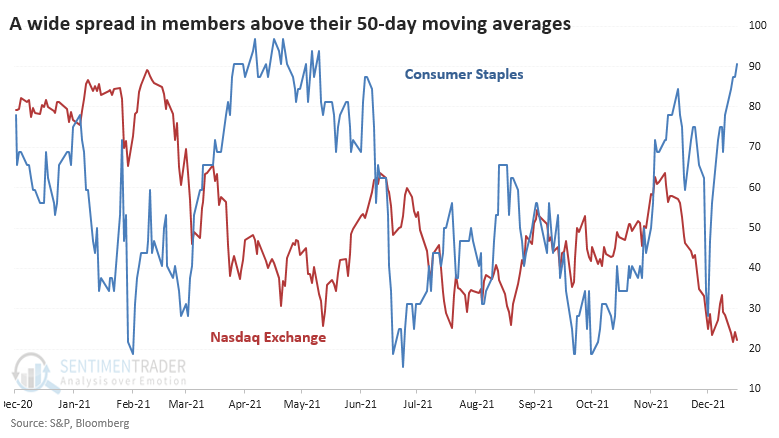
That's the widest spread in trends between the two groups in at least 30 years.

It wasn't very successful if we took this as a warning sign for the broader market. Looking at returns in the S&P 500 after every signal since 1990, only one of them preceded a large and protracted decline.

Stat box

With an average daily move of more than 1.3% through the first 3 weeks of the month, the Nasdaq Composite is on track for the 8th most volatile December since its 1971 inception.


Simple trend-following for switching between Emerging Markets and the S&P 500

Jay showed a simple trend-following strategy that switches between emerging markets and the S&P 500.

The chart below displays the fluctuations in the relationship between EM and SPX since the late 1980s.  

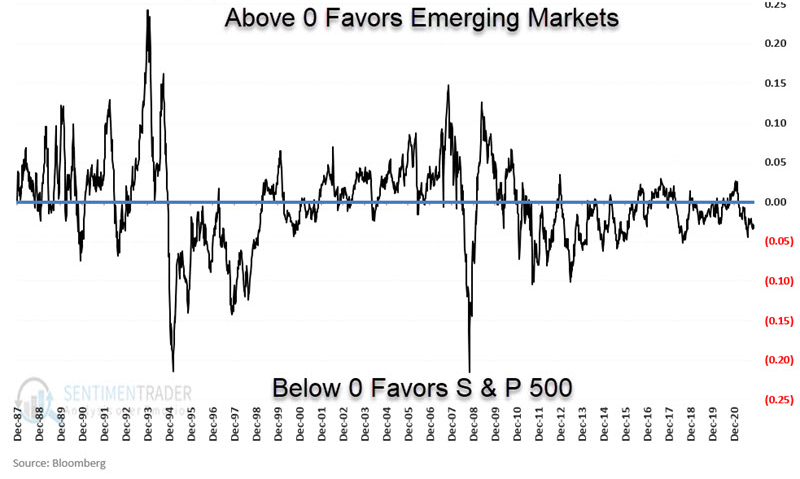
The "Switching" strategy held emerging markets if the trend was positive and the S&P 500 if it was negative. It was 100% invested at all times.

As a baseline, we will also split money evenly between the two indexes and rebalance to a 50/50 split each year's first Friday. We will refer to this as the "Buy/Hold/Rebalance" strategy.

The chart below displays the growth of $1 invested using the Switching strategy versus $1 in the Buy/Hold/Rebalance strategy.

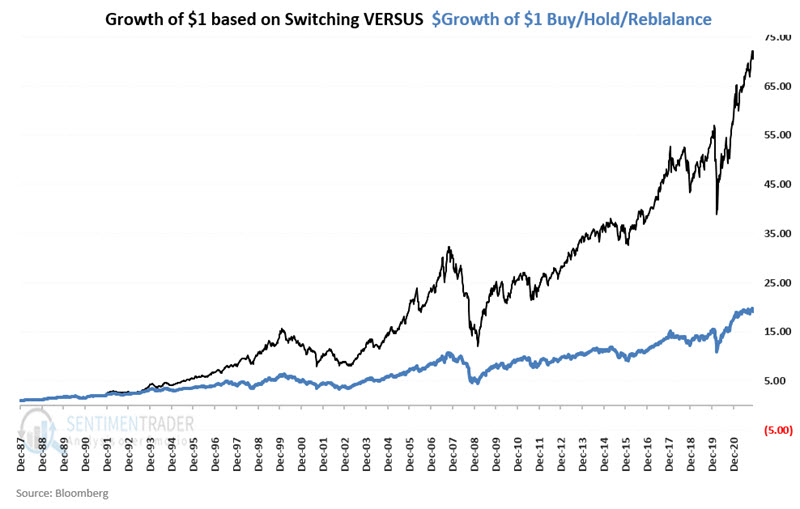
$1 in the Switching strategy grew to $70.91, while $1 in the Buy/Hold/Rebalance strategy grew to $19.08. The Switching strategy outperformed the Buy/Hold/Rebalance strategy by a factor of 3.72-to-1.

DATA &
TECHnologies
IndicatorEdge
‍
BackTestEdge
‍
Other Tools
‍
DataEdge API
RESEARCH
reports
Research Solution
‍
Reports Library
‍
actionable
Strategies
Trading Strategies
‍
Smart Stock Scanner
‍
FREE
RESOUrCES
Simple Backtest
Calculator
Simple Seasonality
Calculator
The Kelly Criterion
Calculator
Sentiment Geo Map
‍
Public Research Reports
‍
Free Webinar
COMPANY
‍
About
‍
Meet our Team
‍
In the News
‍
Testimonials
‍
Client Success Stories
Pricing
Bundle pricing
‍
Announcements
‍
FAQ
© 2024 Sundial Capital Research Inc. All rights reserved.
Setsail Marketing
TermsPrivacyAffiliate Program
Risk Disclosure: Futures and forex trading contains substantial risk and is not for every investor. An investor could potentially lose all or more than the initial investment. Risk capital is money that can be lost without jeopardizing ones’ financial security or life style. Only risk capital should be used for trading and only those with sufficient risk capital should consider trading. Past performance is not necessarily indicative of future results.

Hypothetical Performance Disclosure: Hypothetical performance results have many inherent limitations, some of which are described below. No representation is being made that any account will or is likely to achieve profits or losses similar to those shown; in fact, there are frequently sharp differences between hypothetical performance results and the actual results subsequently achieved by any particular trading program. One of the limitations of hypothetical performance results is that they are generally prepared with the benefit of hindsight. In addition, hypothetical trading does not involve financial risk, and no hypothetical trading record can completely account for the impact of financial risk of actual trading. for example, the ability to withstand losses or to adhere to a particular trading program in spite of trading losses are material points which can also adversely affect actual trading results. There are numerous other factors related to the markets in general or to the implementation of any specific trading program which cannot be fully accounted for in the preparation of hypothetical performance results and all which can adversely affect trading results.

Testimonial Disclosure: Testimonials appearing on this website may not be representative of other clients or customers and is not a guarantee of future performance or success.