
A historic semiconductor surge

Key points:
- On Thursday, a semiconductor index surged by more than 11% and closed at a 12-month high
- Similar surges to a new high preceded bullish upside follow-through, especially over the next month
- When semis soar to a 12-month high but not a 24-month high, the index has never been lower a year later
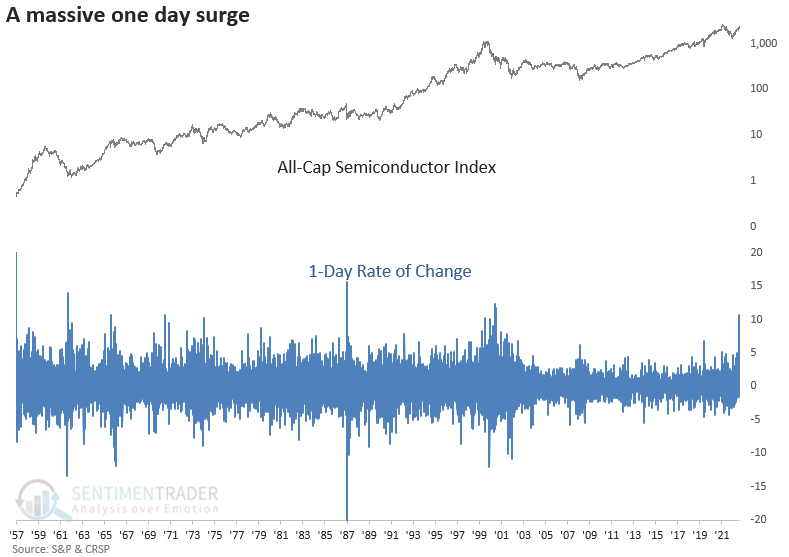
A truly historic surge in a semiconductor index
On Thursday, a semiconductor index surged by more than 11% and closed at a 12-month high on the back of Nvidia's earnings report. A surge of that magnitude to a new high has never happened in history.
Suppose I lower the threshold from 11% to 5%. In that case, I found 23 other historical precedents since 1960.
After highlighting bullish semiconductor patterns in January and last week, the weight of the evidence continues to look favorable for the group.
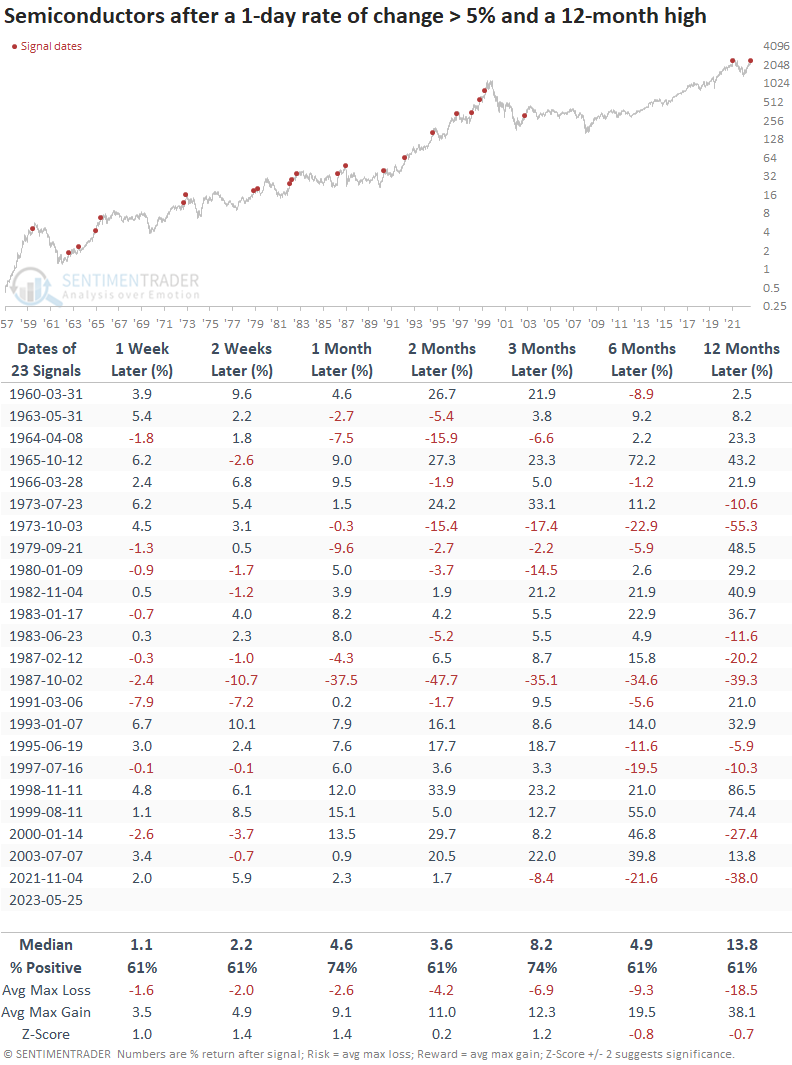
Similar surges to a new high preceded bullish upside follow-through
When the semiconductor index surges by more than 5% in a single day and closes at a 12-month high, the bullish momentum will likely continue over the near term. A month later, the index was higher 74% of the time, with a nine-signal winning streak. The last loss in that time frame occurred in 1987.
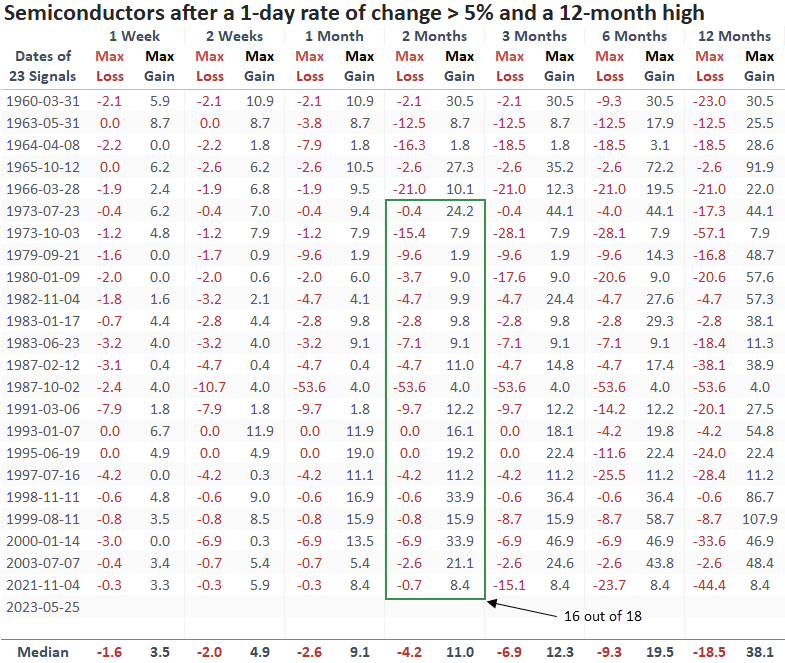
Since 1973, the max gain exceeded the max loss in 16 out of 18 precedents over the two-month horizon. And the signal showed a max loss of greater than -10% only five times in history over the same time frame.
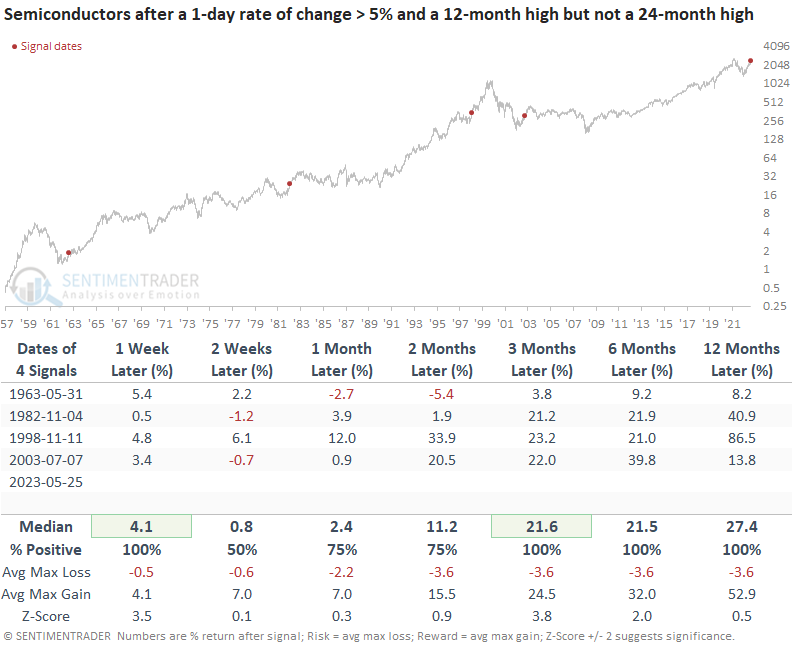
Additional context
While the semiconductor index surged more than 5% to a 12-month high, the index did not close at a 24-month high. While rare, a 5% surge to a 12-month high but not a 24-month high bodes well for the group over the next year.
What the research tells us...
One of the most challenging aspects of investing is finding the proper balance between how much one should emphasize the top-down broad market outlook versus the micro or bottom-up trends for stocks, sectors, and industries. Investors that ignored overall market trends and drilled down to micro trends with relative strength indicators were rewarded handsomely by energy in 2021-22 and now technology/semiconductors in 2023. With semiconductors surging more than 5% to a 12-month high, the bullish momentum for the group should continue, especially since the industry remains below a multi-year high.