
A historic reversal in the 10-year yield

Key points:
- Over the last three weeks, the 10-year Treasury yield experienced a sharp reversal from a 3-year high
- Following similar patterns, the 10-year could see additional downside follow-through over the short-term
- The collective analysis of absolute and relative trend models reaffirms the ongoing uptrend in yields
Does the swift reversal in the 10-year Treasury yield suggest a trend change?
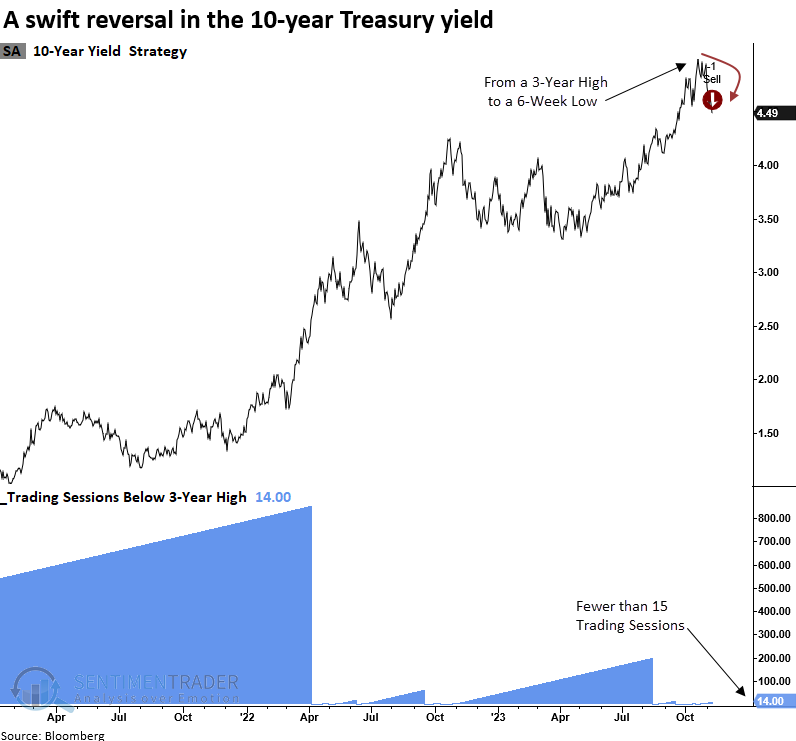
In the wake of the FOMC holding the target rate steady once more and the Treasury's Quarterly Refunding Announcement revealing a preference for short-duration T-bill issuance, traders swiftly seized the opportunity to acquire long-dated bonds, resulting in one of the most rapid reversals in history.
The 10-year bond saw a remarkable reversal, as the benchmark yield shifted from a 3-year high to a 6-week low in under 15 trading sessions.
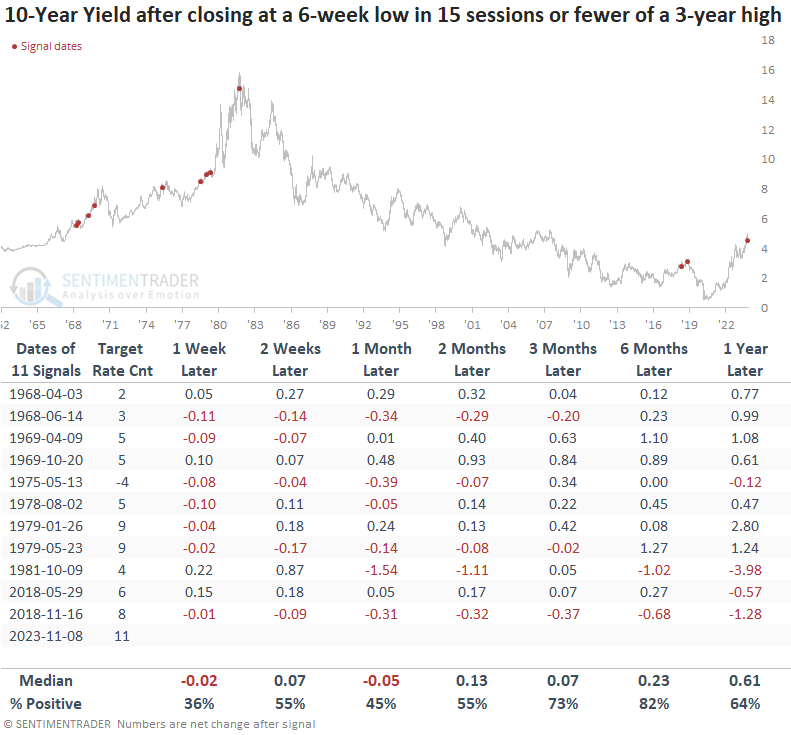
This unique pattern has been witnessed on just 11 other occasions in history.
The 10-year yield could see some further softening
When the 10-year yield experiences a rapid drop from a 3-year high to a 6-week low in 15 sessions or less, the benchmark yield tends to follow the same trend by declining further. At some point over the next month, 8 out of 11 precedents saw lower bond yields. However, from three to twelve months later, the 10-year yield was higher at some point in all but one case.
Before 2018, a swift downward shift in the 10-year was only witnessed during the secular uptrend in yields from 1945 to 1981.
A slightly different take on the reversal
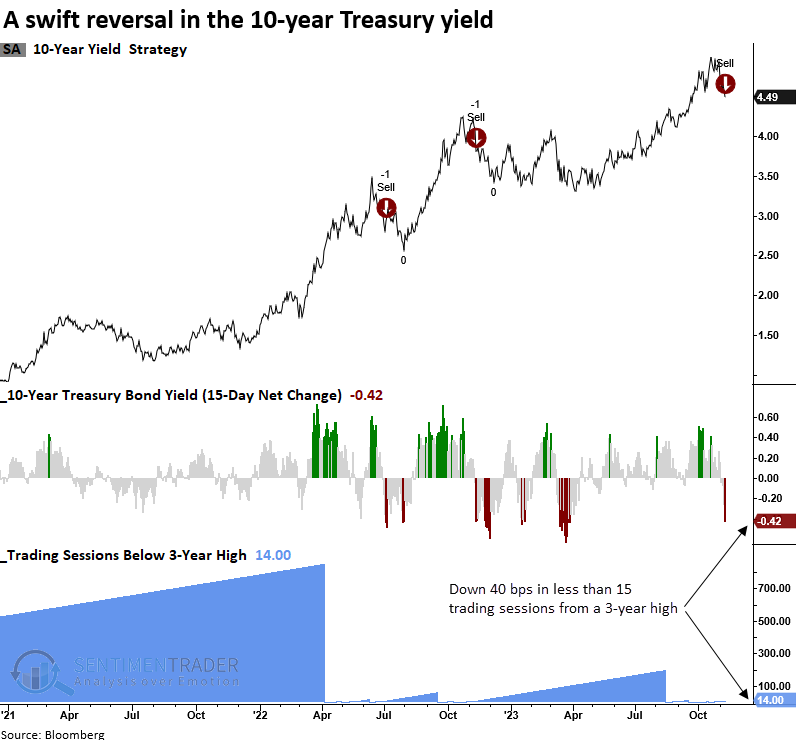
For only the 10th time in history, the 10-year yield declined by more than 40 basis points from a 3-year high in fewer than 15 trading sessions.
Should the 10-year yield experience a 40 basis point decline in 15 trading sessions or fewer from a 3-year high, it implies an underlying upward bias across most time horizons. More importantly, before 2022, reversals of this nature have only occurred in secular uptrends in yields. Therefore, It's imperative to keep an open mind that the current interest rate uptrend may be a secular rather than cyclical advance.
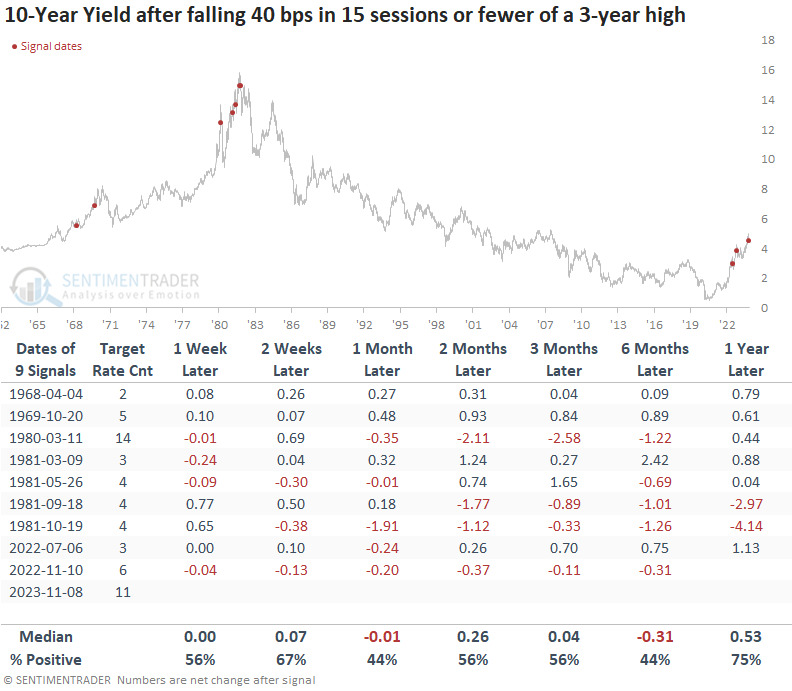
Edit: I corrected an error in the 1-year forward column for the 2022-11-10 signal.
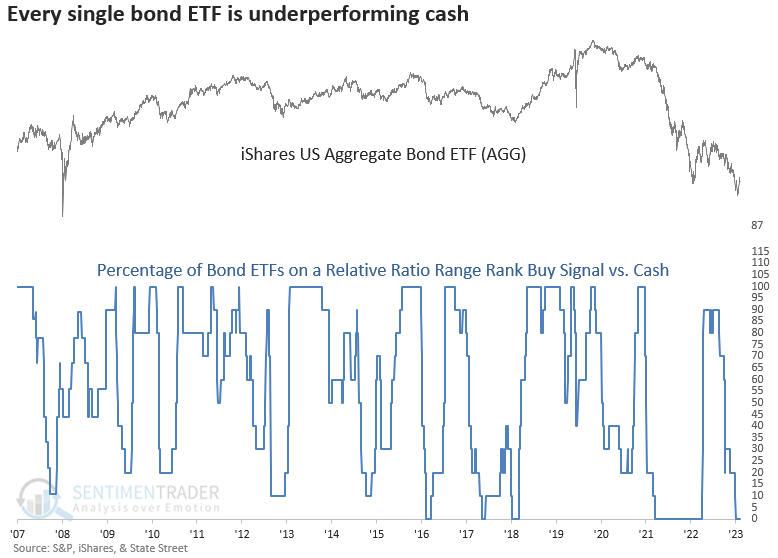
Bonds relative to cash
In a recent note titled "Cash is King," I shared a composite that measures whether ten diverse bond ETFs are on a buy signal relative to a cash proxy. Despite the sharp move lower in the 10-year yield and other bond components, the composite did not generate any new buy signals. In the event of a notable shift in bond yield trends, this model should wave the all-clear signal.
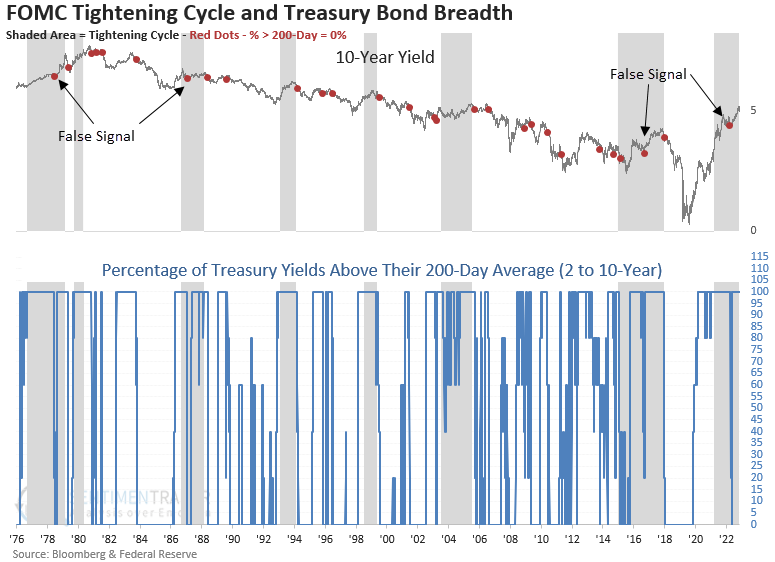
Treasury bond market breadth
Once the Federal Reserve completes its interest rate hiking cycle, the percentage of Treasury bond yields trading above their 200-day average should provide a timely signal for a bullish bond trade.
What the research tells us...
We've reached one of those macro-driven moments in history when stocks cling to every move in the bond market. Long-duration bond yields reversed sharply after the FOMC and Treasury announcements. Similar rate reversals hint at the possibility of a further softening in the 10-year yield in the immediate future, likely bolstering stocks. From a big-picture perspective, the action in bond prices could indicate that yields are in a secular uptrend. Several bond models confirm the evidence from the reversal studies, suggesting yields remain firmly entrenched in an uptrend.