
A historic relative plunge in the average stock

Key points:
- A handful of big Technology stocks have driven the capitalization-weighted S&P 500 index to decent gains this year
- The equal-weight version of the index has languished and is down 8% relative to the other version since February
- Similar large declines in the ratio between the two indexes preceded outsized gains for the average stock
A few surging stocks haven't helped "average" investors
A couple of times in recent weeks, we've looked at the rally's primary drivers in the world's most benchmarked index. It's no secret that a handful of behemoth Technology stocks are a major driving force behind this year's gains.
So far in 2023, the S&P 500 index that everyone watches is showing a respectable gain. The equal-weighted version of the index, which weights each of the 500+ stocks equally, is struggling to hold any year-to-date gains at all.
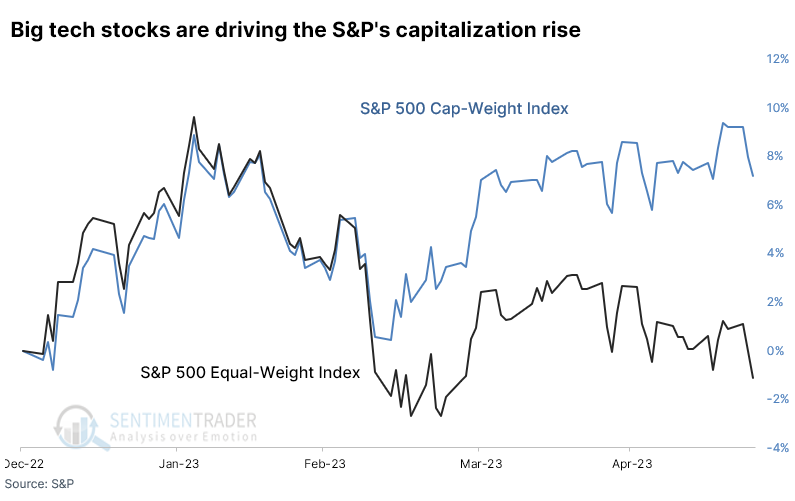
The indexes were tracking closely until the last few months. Since then, the surge in Tech stocks pushed the ratio between the two versions of the index out of whack. The 3-month rate of change in the ratio of the equal-weight to cap-weight versions plunged 8%, among the worst declines since the 1990 inception of the equal-weight index.
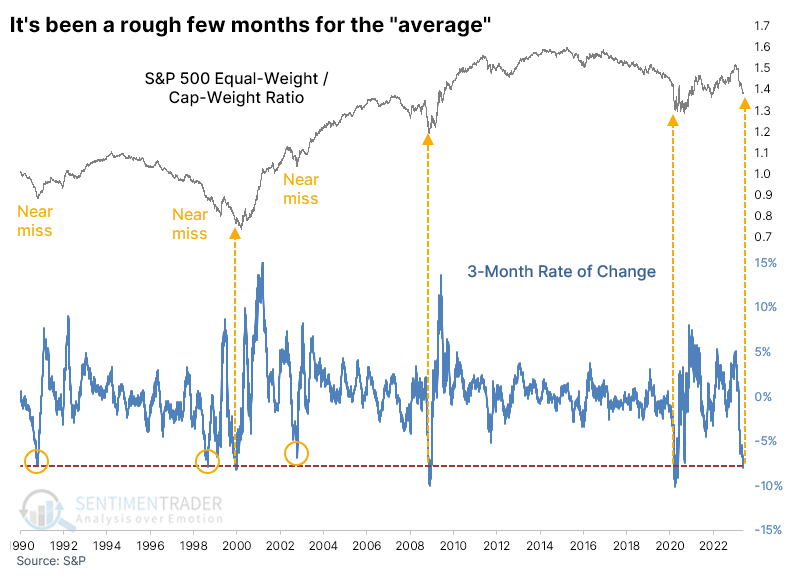 A few times, the decline didn't quite reach the -8% threshold. Two coincided with an imminent turn in the ratio, with the equal-weight version outperforming the cap-weight version for a couple of years afterward.
After big declines in the ratio, the average stock shined
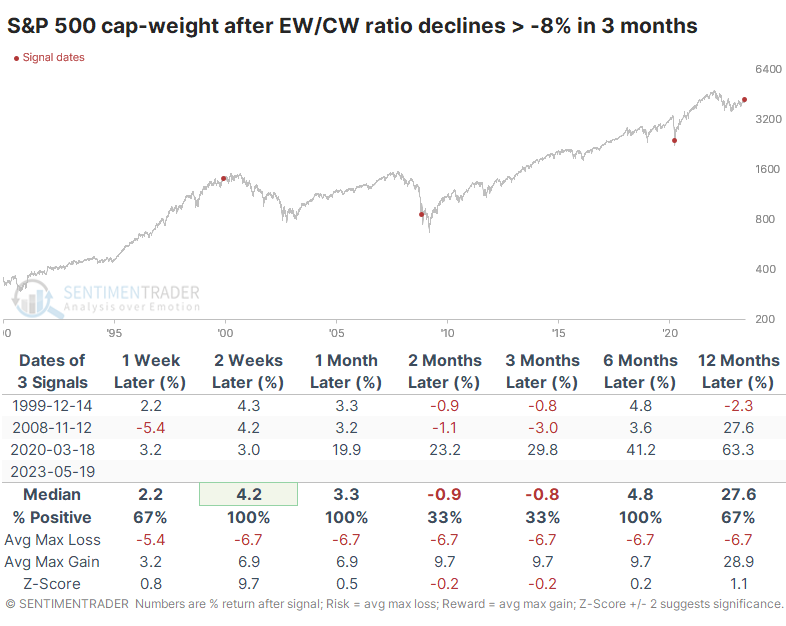
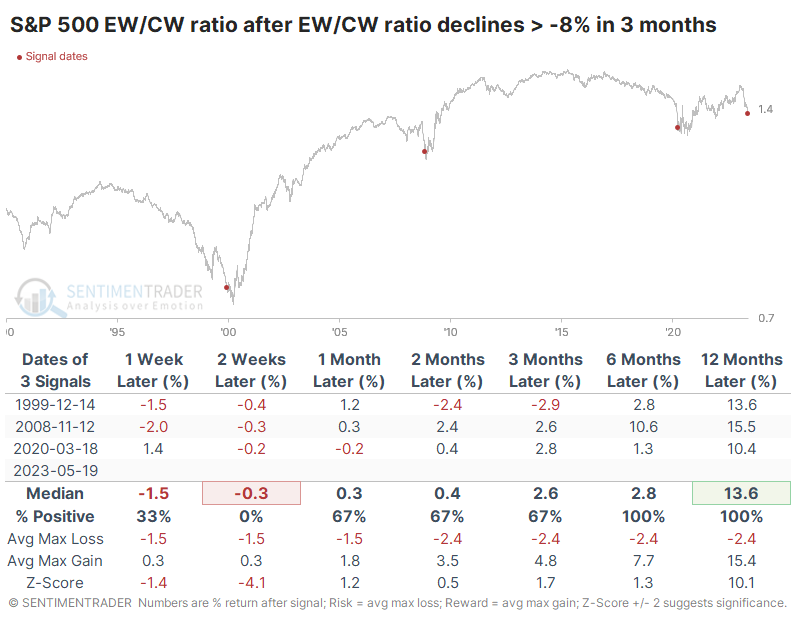
The table below shows returns in the cap-weight version (the standard one that everyone watches) after the few times the ratio declined at least 8% over three months. Two preceded mediocre returns over the next few months, and one was at the low during the pandemic.
The equal-weight version of the index performed better after these signals. The six- and twelve-month returns were excellent, with minimal drawdowns though the volatility in 2008 was uncomfortable.
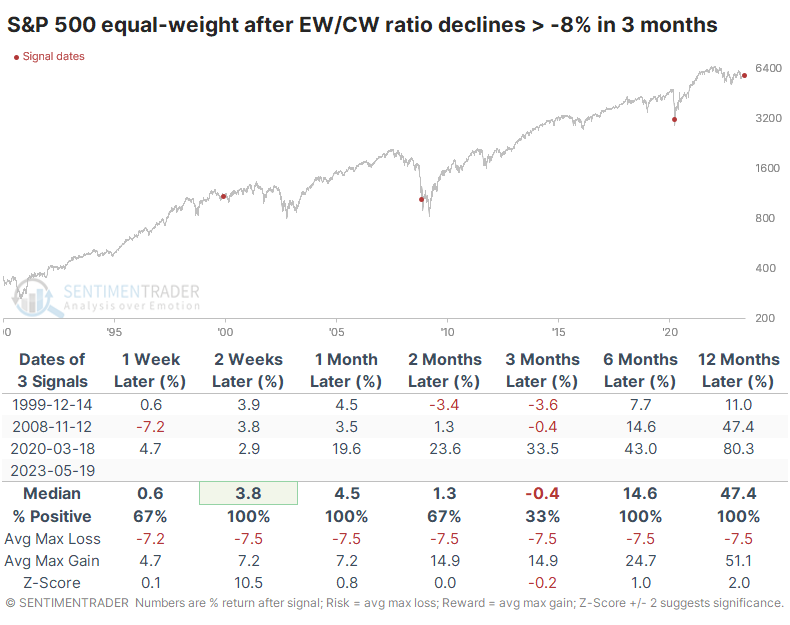
Because the equal-weight returns were mostly better than the cap-weight returns, the ratio between the indexes mostly showed gains after the first couple of weeks. Over the following year, the equal-weight version of the S&P 500 outperformed by more than 10% after each signal.
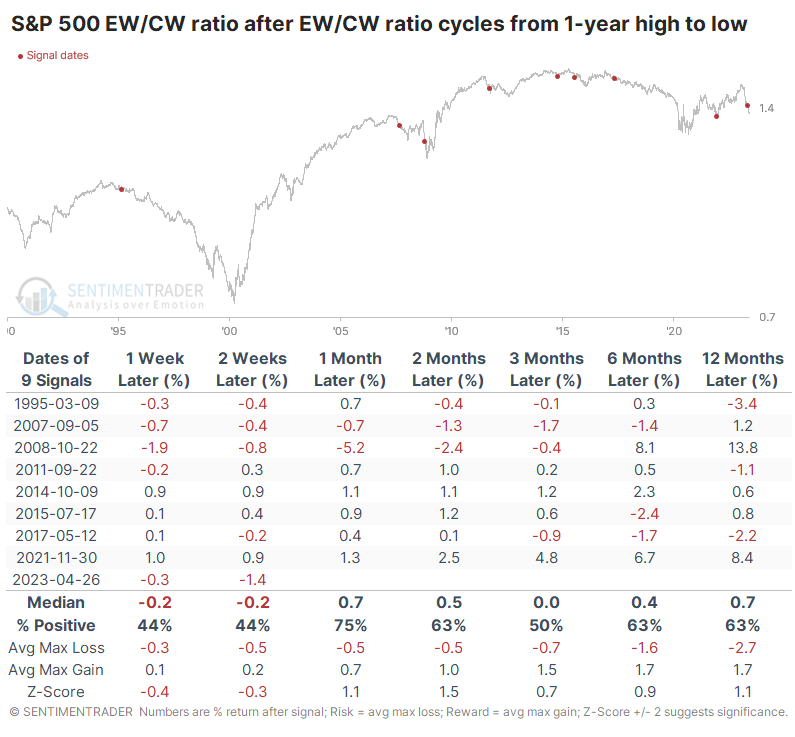
There are other ways to view the performance of the two indexes. One preferred way we look at data similar to this is cycles, like seeing what happens when it goes from one extreme to the other. The table below shows returns in the ratio when it cycles from at least a one-year high to a one-year low.
This triggered in late April, and the ratio has continued lower, which isn't unusual. There wasn't a strong bias in the returns, though there was a modest tendency to see the equal-weight version of the index resume its leadership after similar cycles.
What the research tells us...
The hand-wringing over a handful of stocks driving major indexes higher this year doesn't have a lot of empirical support. It's hard to find evidence that such behavior is necessarily bad for markets. What it has clearly done, however, is frustrate those who don't want to have outsized exposure to a handful of stocks. With a relatively short history and the necessary limitation of looking at extremes, it's hard to place much weight on extremes like we're seeing now. Still, the history we do have suggests that declines like this in the equal-weight S&P 500 should be reversed in the months ahead. Those betting on 500 stocks performing better than 5 have some support for their view.