
A historic performance gap between the S&P 500 and gold

Key points:
- The 3-month rate of change spread between the S&P 500 and gold futures plunged below -24%
- Comparable performance gaps indicate that stocks might rebound in the coming months
- Should stocks rally, gold is likely to face challenges over the next few months
A differentiated view of market sentiment through the lens of stocks versus gold
Over the last three months, the S&P 500 has underperformed gold futures by -24%, the widest margin since March 2022, a period marked by stock market stress and demand for safe-haven assets. Does the significant performance gap between stocks and gold signal too much fear?
Like last week's analysis comparing the S&P 500 to copper, this study aims to shed light on the relationship between two typically uncorrelated asset classes, helping to determine whether the current pullback is a routine correction within a bull market or the start of a more meaningful shift toward a bear market.
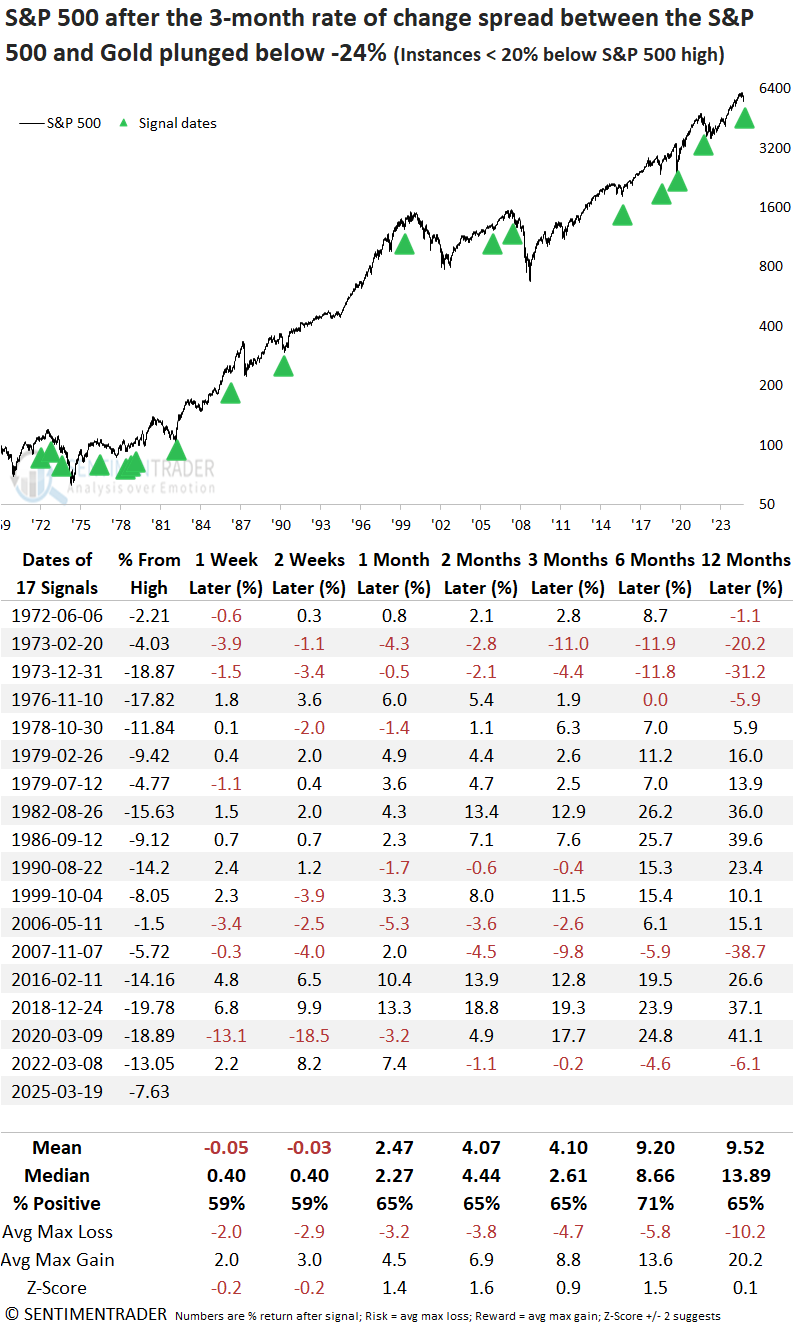
As shown in the chart below, a spread reading below -24% has occurred only 5% of the time since 1970 and has typically led to significant up days, resulting in an annualized S&P 500 return of 50%.
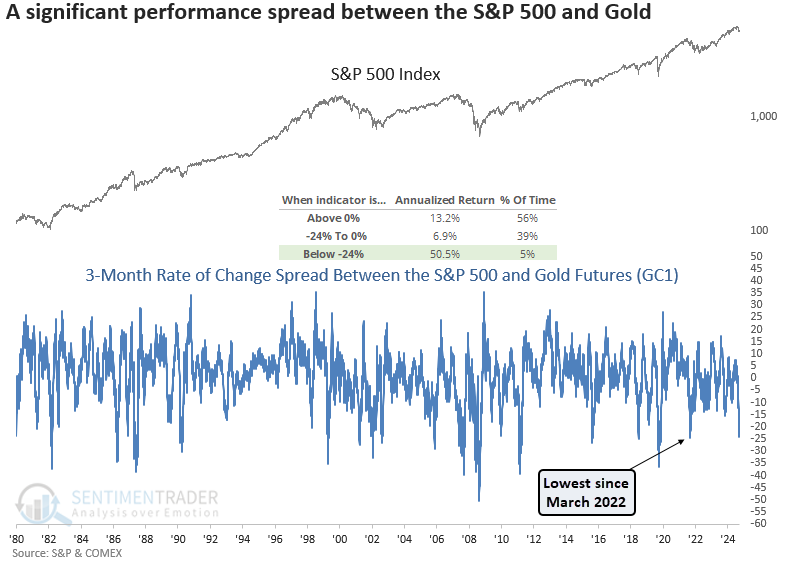
Similar spread conditions hint at a potential bounce once the market stabilizes
Whenever the 3-month rate of change spread between the S&P 500 and gold futures dropped below -24%, the world's most benchmark equity index displayed a slightly unfavorable outlook over the subsequent few weeks, suggesting a choppy bottoming process. However, once the dust settled, the large-cap index rallied 65% of the time over the next two months, with a return that approached significance relative to random performance.
From a big-picture perspective, most precedents occurred in significant corrections or bear markets.
Although most sectors recorded negative returns in the initial weeks, defensive groups such as consumer staples and health care posted gains and outperformed the S&P 500 over two months.
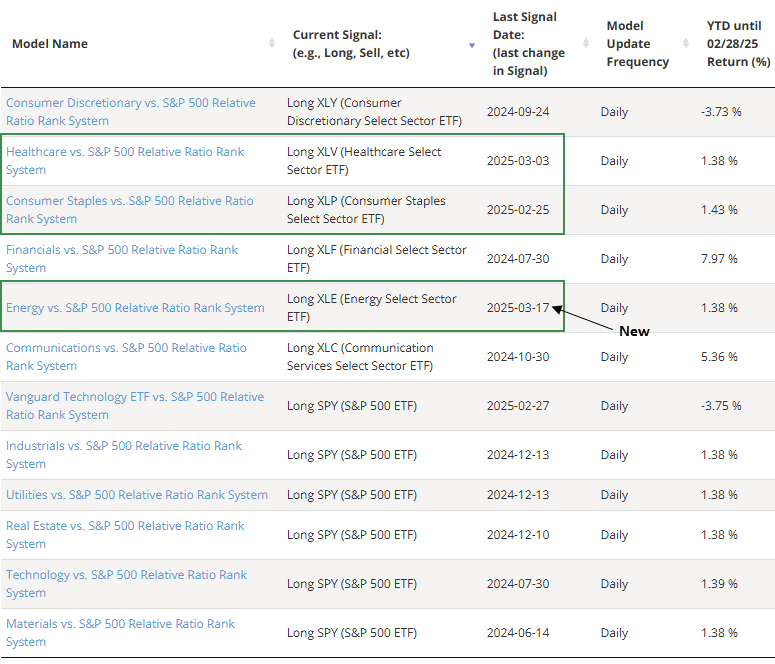
The energy sector stood out over longer horizons, which is interesting given that the relative strength timing system on the website recently initiated a position, joining consumer staples and health care.
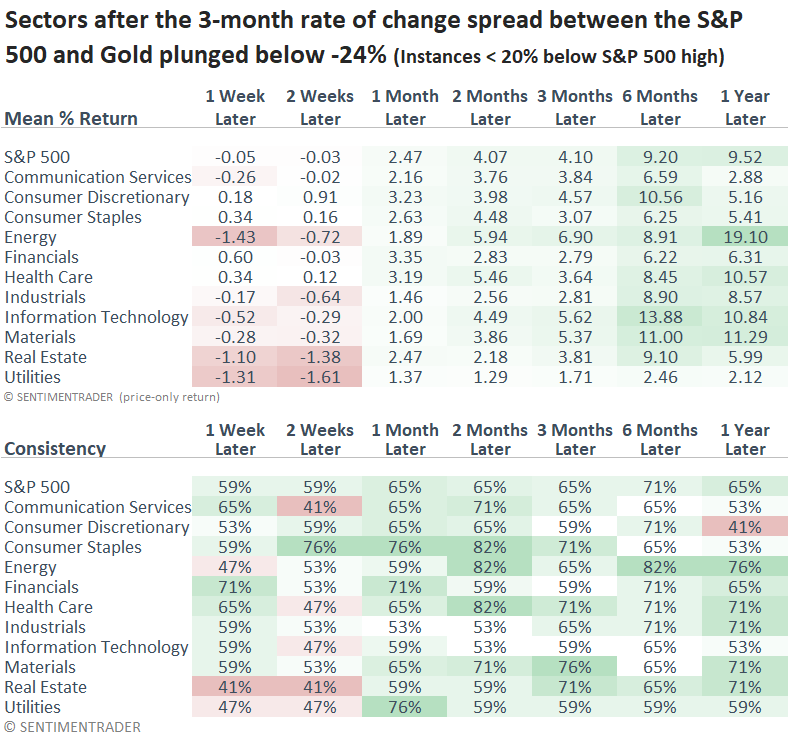
Several of the website's current relative strength timing signals align with the outlook presented in the above sector table.
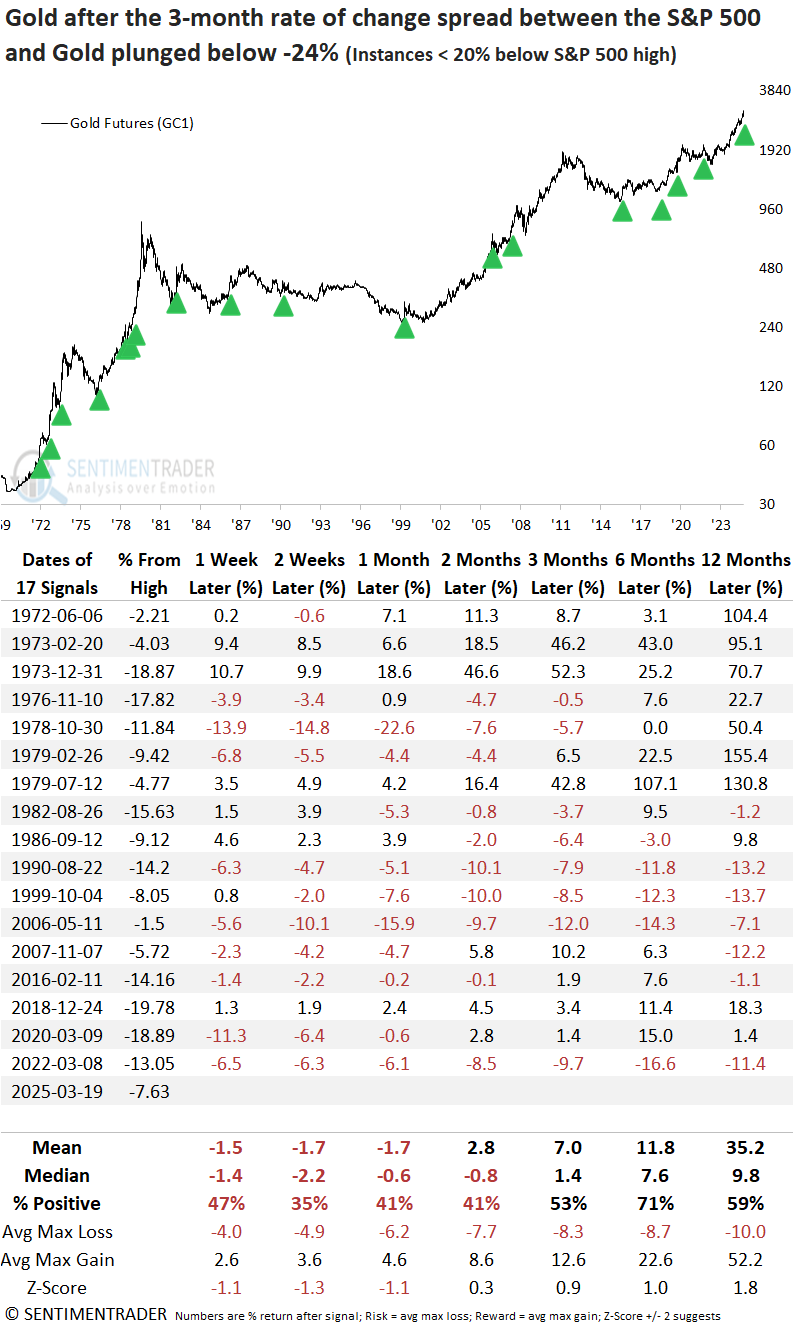
What about Gold?
The precious metal was likely to face pressure over the first few months after the SPX-GC rate of change spread slipped below -24%, suggesting that traders were less inclined to maintain positions in a safe-haven asset like gold. It's worth noting that since gold's peak in 1980, both returns and win rates have significantly underperformed compared to the period before, when the precious metal was in a bubble.
What the research tells us...
The S&P 500 has declined while gold futures have climbed, widening the 3-month rate spread between the two assets to its most significant gap in over two years. Historically, such divergences have reflected heightened trader pessimism and often signaled a bottoming process and subsequent relief rally in stocks over the next few months. Should stocks stage a rebound, gold, a safe-haven asset, could face near-term pressure and consolidate within its long-term uptrend.