Products
SentimenTrader Trading Tools
‍
Backtest Engine
My Trading Toolkit
Correlation Analysis
Seasonality
Market Prediction
Indicators & Data API
‍
Proprietary Indicators & Charts
Market Data API
Strategies & Scanner
‍
50+ Trading Strategies
Smart Stock Scanner
Smart Option Scanner
Research Reports
‍
Research Solutions
Reports Library
Free Resources
Simple Backtest Calculator
Simple Seasonality Calculator
The Kelly Criterion Calculator
Sentiment Geo Map
Public Research Reports
Education
Sentiment Indicators
Technical Indicators
Pricing
Company
About
In the News
Testimonials
Client Success Stories
Contact
Log inLoginSign up
< BACK TO ALL REPORTS

A historic expansion in new highs for small caps

Dean Christians
2023-12-15
Breakouts across small, medium, and large-cap stocks have expanded to some of the highest levels in over four decades. Similar explosions in the new highs list produced bullish outcomes for small and large-cap indexes over all time frames. Twelve months later, the Russell 2000 was higher every time.

Key points:

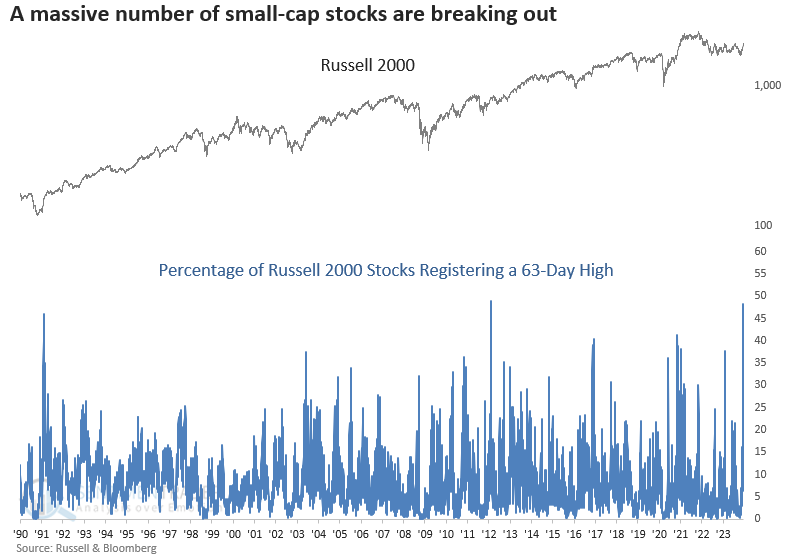
  • The percentage of small-cap stocks registering a 63-day high surged to one of the highest levels in history
  • Similar expansions in new highs produced excellent outcomes, with a 100% win rate a year later
  • A small, medium, and large capitalization stock index also recorded a signficant expansion in new highs

Participation is broadening across all stock market capitalizations

Throughout 2023, the prevailing narrative has centered around the notion that seven stocks solely propelled the market's upward trajectory. Although it's undeniably true that these Mag-7 stocks have played a substantial role in the overall gains of the S&P 500, it's essential to recognize that many opportunities have existed outside of a handful of bellwethers.  

One area where opportunities have been limited is small-capitalization stocks. However, investors should take another look at this out-of-favor group. 

On Thursday, the percentage of Russell 2000 stocks recording a 63-day high increased to 48%, reaching the 5th highest level in history. 

Similar expansions in new highs preceded excellent results

When the percentage of Russell 2000 stocks registering a 63-day high increased above 38%, returns, win rates, and z-scores for the small-cap index were outstanding. A year later, the index was higher every time. 

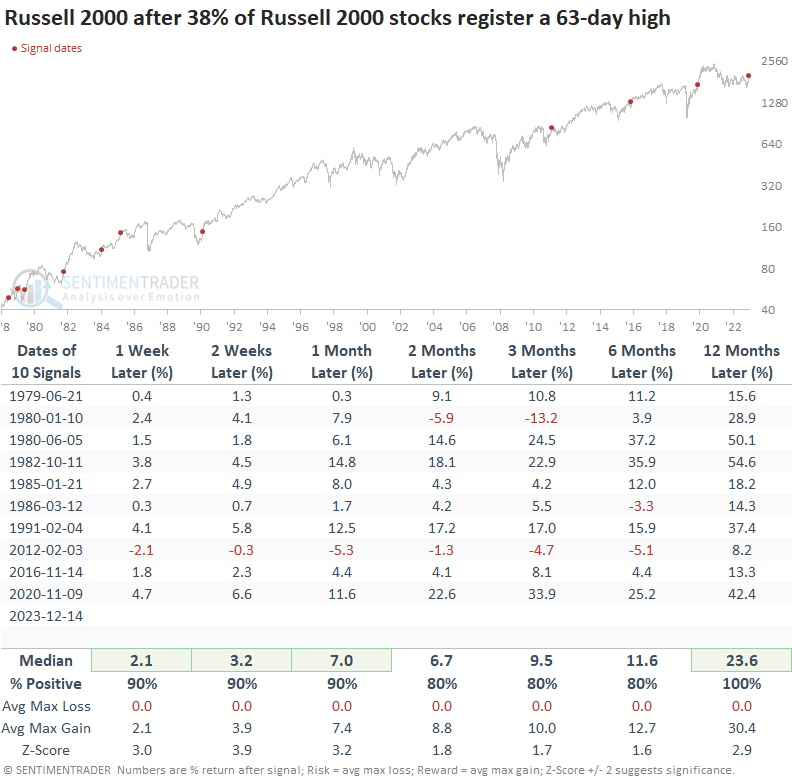
I lowered the signal threshold from 48% to 38% to capture more precedents. 

Should we consider an allocation to small caps?

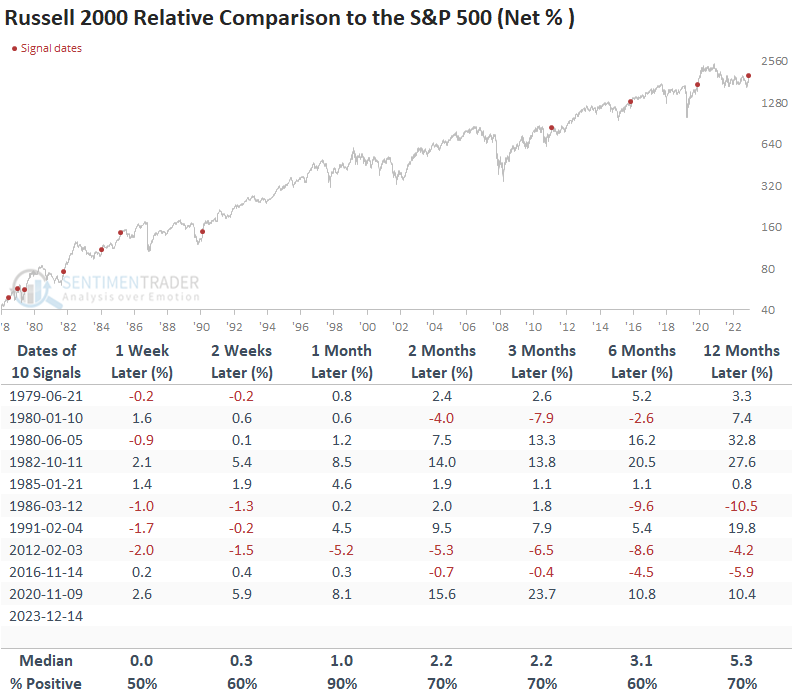
A comparison between the Russell 2000 and the S&P 500 suggests investors should consider an allocation to small-cap stocks. As always, it is imperative to use relative strength indicators for timing and sector selection.

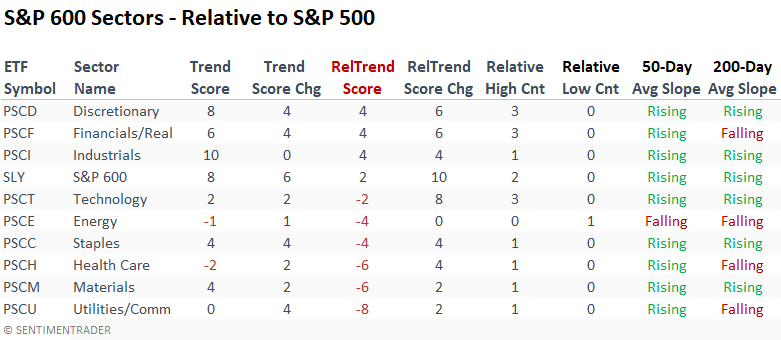
Every sector except energy has witnessed a positive relative trend score change over the last week. Interestingly, the S&P 600 recorded the most significant jump with a ten-point change.  

Breakouts are prevalent across all stock market capitalizations

Members in the S&P 1500, an index containing small, medium, and large capitalization stocks, recorded the highest expansion in 63-day highs since October 1982.

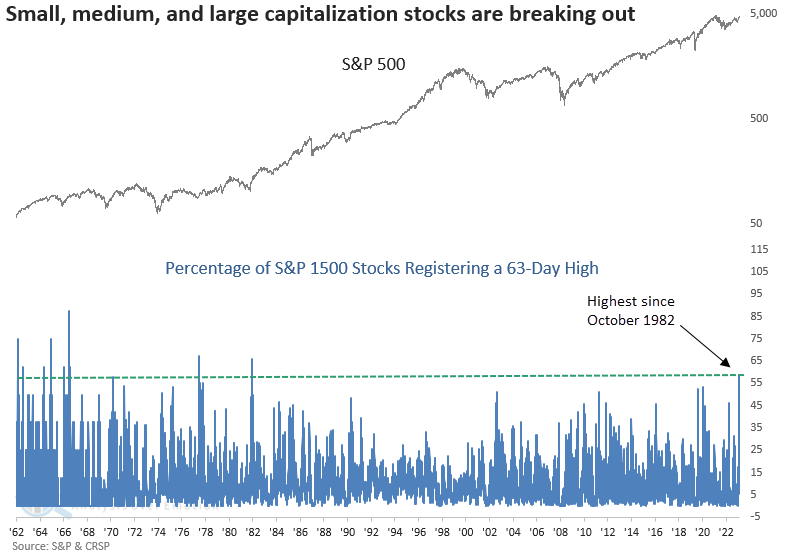
When 63-day highs expand like now, the S&P 500 displayed excellent results across all time horizons. Twelve months later, the world's most benchmarked index was higher in all but one case.

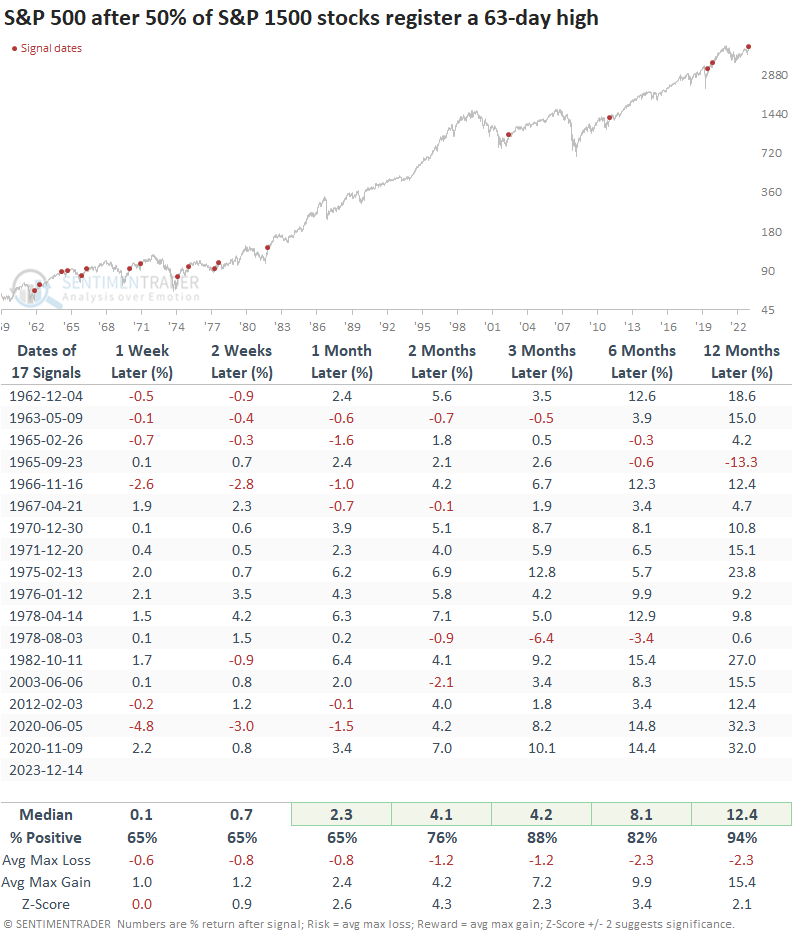
What the research tells us...

Since peaking in 2021, the Russell 2000, a broad measure of small-capitalization stocks, has been a perennial underperformer, succumbing to the pressure of higher interest rates. However, small-cap stocks recently exploded higher, with the outlook for rates looking more favorable, recording a historic expansion in 63-day highs. After similar breakout conditions, the Russell 2000 was higher a year later every time. The S&P 1500, an index containing small, medium, and large-cap stocks, also registered a signficant expansion in 63-day highs, reaching the highest level in over 40 years. Similar alerts were exceedingly bullish. Remember, markets rarely, if ever, peak when new highs are expanding, which is the case now.

PRODUCTS
SentimenTrader
Trading Tools
Indicators & Data API
‍
Strategies & Scanner
‍
Research Reports
FREE
RESOUrCES
Simple Backtest
Calculator
Simple Seasonality
Calculator
The Kelly Criterion
Calculator
Sentiment Geo Map
‍
Public Research Reports
‍
Education
Sentiment Indicators
‍
Technical Indicators
‍
Pricing
Bundle pricing
‍
FAQ
‍
Announcements
‍
COMPANY
‍
About
‍
In the News
‍
Testimonials
‍
Client Success Stories
CONTACT
‍
General Inquiries
‍
Media Inquiries
‍
Financial Professionals Inquiries
‍
© 2026 Sundial Capital Research Inc. All rights reserved.
Setsail Marketing
TermsPrivacyAffiliate Program
Risk Disclosure: The information and tools provided are for research and analytical purposes only and are not intended as investment advice. Market analysis involves uncertainty, and outcomes may differ from expectations. Users should conduct their own due diligence and consider their individual circumstances before making any financial decisions. Past performance is not necessarily indicative of future results.

Hypothetical Performance Disclosure: Hypothetical performance results have many inherent limitations, some of which are described below. No representation is being made that any account will or is likely to achieve profits or losses similar to those shown; in fact, there are frequently sharp differences between hypothetical performance results and the actual results subsequently achieved by any particular trading program. One of the limitations of hypothetical performance results is that they are generally prepared with the benefit of hindsight. In addition, hypothetical trading does not involve financial risk, and no hypothetical trading record can completely account for the impact of financial risk of actual trading. for example, the ability to withstand losses or to adhere to a particular trading program in spite of trading losses are material points which can also adversely affect actual trading results. There are numerous other factors related to the markets in general or to the implementation of any specific trading program which cannot be fully accounted for in the preparation of hypothetical performance results and all which can adversely affect trading results.

Testimonial Disclosure: Testimonials appearing on this website may not be representative of other clients or customers and is not a guarantee of future performance or success.