Data &
Technology
Research
Reports
Report Solutions
Reports Library
Actionable
Strategies
Free
Resources
Simple Backtest Calculator
Simple Seasonality Calculator
The Kelly Criterion Calculator
Sentiment Geo Map
Public Research Reports
Free Webinar
Pricing
Company
About
Meet Our Team
In the News
Testimonials
Client Success Stories
Contact
Log inLoginSign up
< BACK TO ALL REPORTS

A historic drop in uptrends

Jason Goepfert
2021-01-29
In a single day, more than 20% of stocks in the S&P 500 moved below their 50-day moving averages.

Earlier this week, there were some dangerous signs underlying stocks' internal participation. Despite major indexes hitting new highs, some shorter-term breadth measures were showing rare and mostly troubling lags.

When stocks tumbled on Wednesday, the overwhelming number of declining issues pushed the McClellan Oscillator further below zero, to the point where it's already suggesting oversold conditions. 

There was also a dramatic drop in the percentage of members in the S&P 500 holding above their 50-day moving averages. It plunged more than 20% on Wednesday alone, one of the largest single-day drops in medium-term trends in years. Even so, well over 75% of stocks are still holding long-term uptrends, trading above their 200-day moving averages. 

S&P 500 members above 50 and 200 day moving average

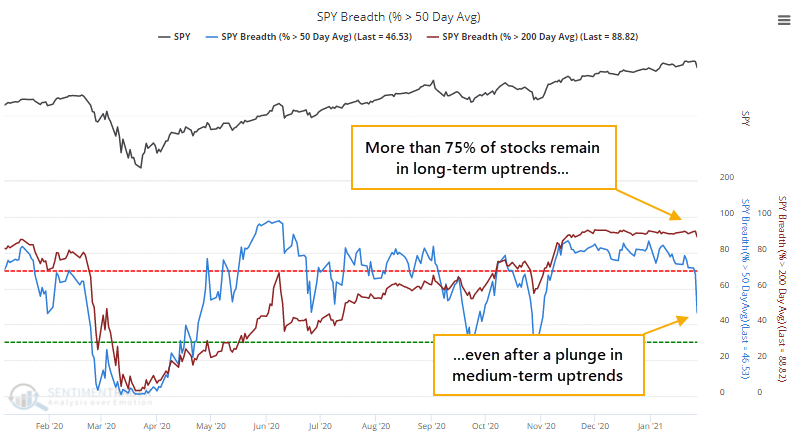
Looking at similar behavior since 1928, a swift correction in medium-term trends within the context of long-term uptrends has usually resolved to the upside, especially over the next 3-6 months. Three months later, there was only a single small loss, and the risk/reward was excellent.


What else we're looking at

  • What happens when the McClellan Oscillator gets oversold within only a few days of stocks sitting at new highs
  • Full returns following a drop in members above their 50-day moving averages but most of them above their 200-day averages
  • Investors still aren't totally in risk-off mode - there are relatively few defensive stocks outperforming the S&P 500
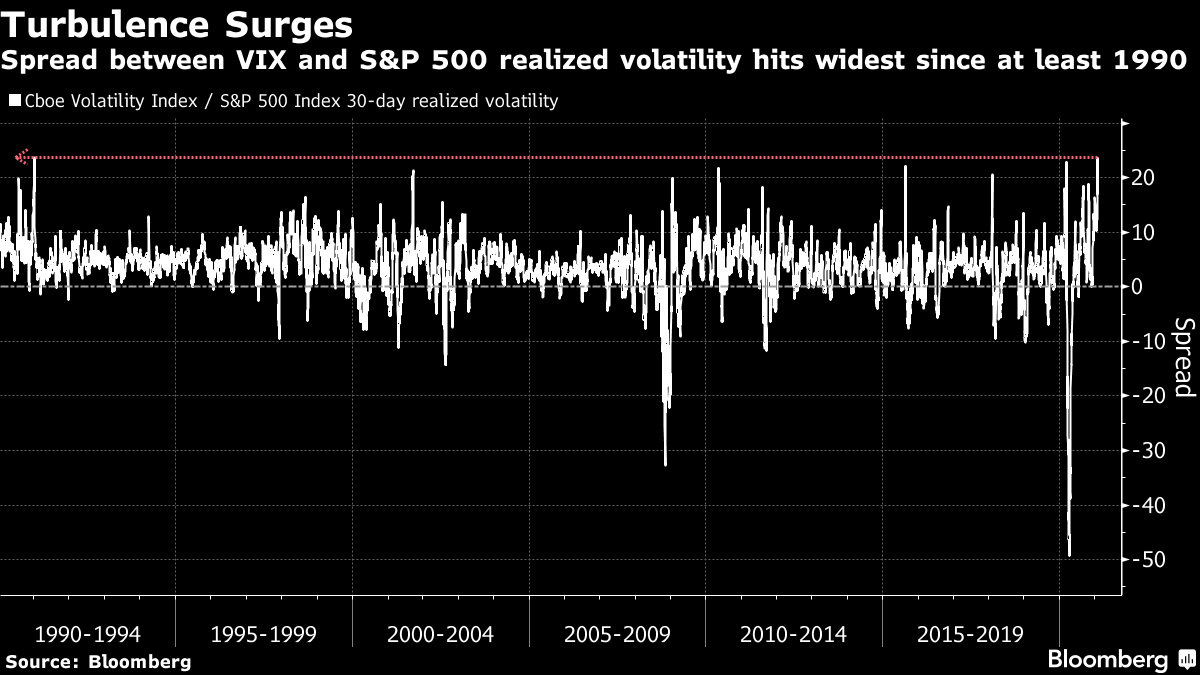
  • Despite a jump in the VIX, high-yield credit spreads aren't blowing out
  • What happens when investment managers suddenly reduce exposure
  • There has been a quick change in the % of stocks at 1-month highs vs lows
  • As we near the end of winter, two commodities show vastly different seasonal tendencies

Stat Box

A survey of active investment managers from NAAIM showed that professional investors reduced their net exposure to stocks by nearly 30% in a single week, one of the largest declines in the history of the survey. The only time it occurred in the same week stocks hit a 52-week high was at the end of August 2014.


Sentiment from other perspectives

Volatility jumped this week, but implied volatility jumped even more. Options traders are pricing in bigger moves than the S&P 500 is currently undergoing, bringing the VIX close to levels that can see spillover to credit. Source: Bloomberg Weekly Fix

vix versus historical volatility

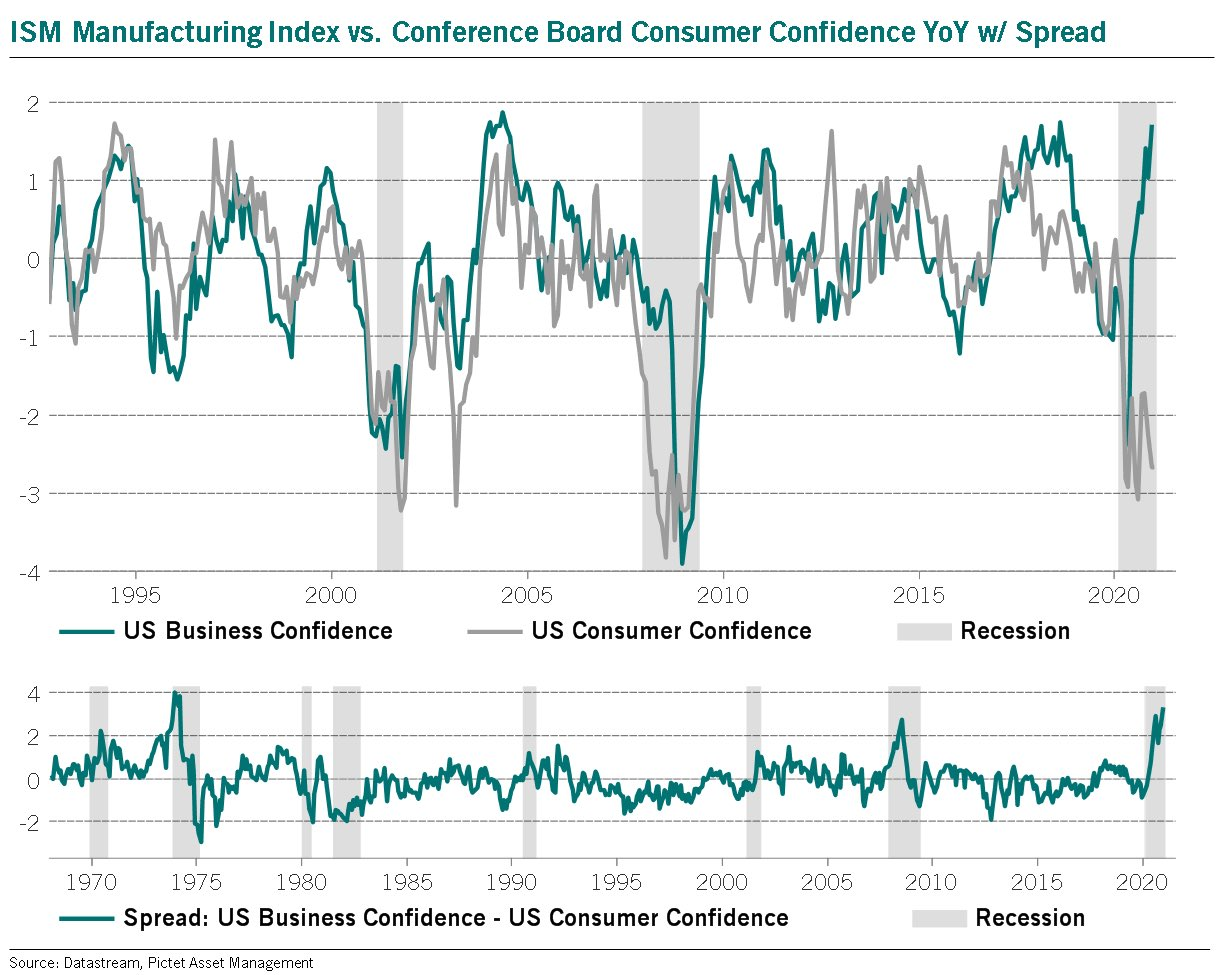
Businesses have never been more confident while consumers were so negative. Trends in sentiment between the groups have never been wider. Source: Pictet

business versus consumer confidence

It's easy to say "this will not end well," but this will not end well if history is any guide whatsoever. Source: WSJ, NY Post, Apple Store

headlines about stocks

DATA &
TECHnologies
IndicatorEdge
‍
BackTestEdge
‍
Other Tools
‍
DataEdge API
RESEARCH
reports
Research Solution
‍
Reports Library
‍
actionable
Strategies
Trading Strategies
‍
Smart Stock Scanner
‍
FREE
RESOUrCES
Simple Backtest
Calculator
Simple Seasonality
Calculator
The Kelly Criterion
Calculator
Sentiment Geo Map
‍
Public Research Reports
‍
Free Webinar
COMPANY
‍
About
‍
Meet our Team
‍
In the News
‍
Testimonials
‍
Client Success Stories
Pricing
Bundle pricing
‍
Announcements
‍
FAQ
© 2024 Sundial Capital Research Inc. All rights reserved.
Setsail Marketing
TermsPrivacyAffiliate Program
Risk Disclosure: Futures and forex trading contains substantial risk and is not for every investor. An investor could potentially lose all or more than the initial investment. Risk capital is money that can be lost without jeopardizing ones’ financial security or life style. Only risk capital should be used for trading and only those with sufficient risk capital should consider trading. Past performance is not necessarily indicative of future results.

Hypothetical Performance Disclosure: Hypothetical performance results have many inherent limitations, some of which are described below. No representation is being made that any account will or is likely to achieve profits or losses similar to those shown; in fact, there are frequently sharp differences between hypothetical performance results and the actual results subsequently achieved by any particular trading program. One of the limitations of hypothetical performance results is that they are generally prepared with the benefit of hindsight. In addition, hypothetical trading does not involve financial risk, and no hypothetical trading record can completely account for the impact of financial risk of actual trading. for example, the ability to withstand losses or to adhere to a particular trading program in spite of trading losses are material points which can also adversely affect actual trading results. There are numerous other factors related to the markets in general or to the implementation of any specific trading program which cannot be fully accounted for in the preparation of hypothetical performance results and all which can adversely affect trading results.

Testimonial Disclosure: Testimonials appearing on this website may not be representative of other clients or customers and is not a guarantee of future performance or success.