
A historic divergence between stocks and commodities

Key points:
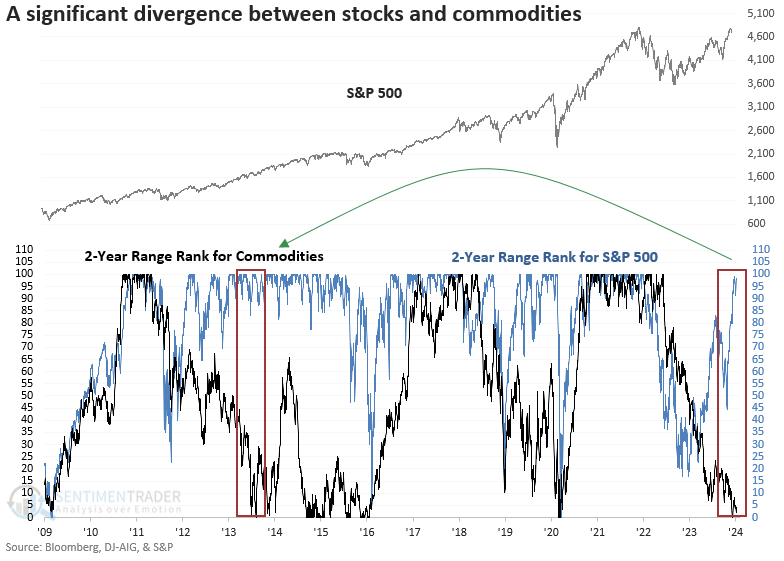
- The S&P 500 is trading near the upper end of its 2-year range, with a commodity index near the lower end
- Similar divergences suggest commodities will continue to struggle as the S&P 500 trends higher
- Growth-oriented stocks outperform, and commodity-based groups underperform
Are commodities flashing a warning sign for stocks and the economy?
There's a persistent belief among the perma-bear community that commodities, which have diverged from stocks by one of the most significant amounts in history, are signaling a recession. Therefore, a bear market in stocks is right around the corner. Yet, as history has demonstrated, this narrative seldom unfolds favorably for the bearish outlook.
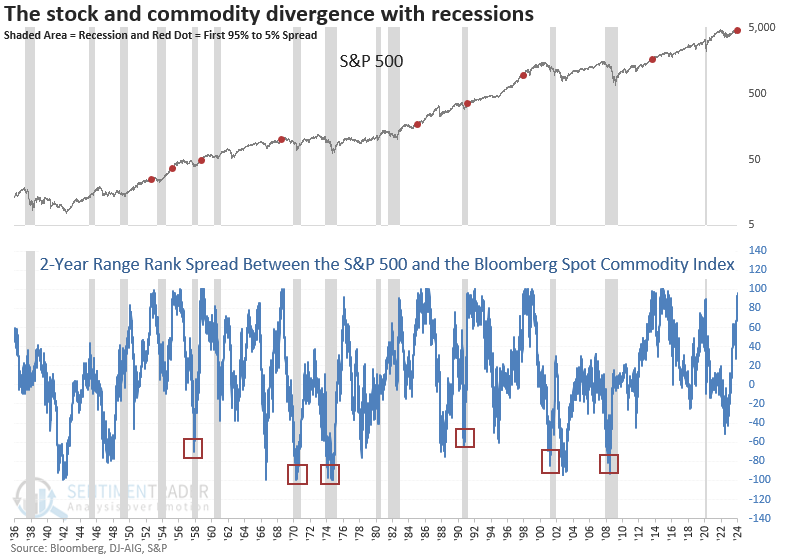
To measure the current divergence relative to history, I applied a 2-year range rank to the S&P 500 and the Bloomberg Spot Commodity Index.
The rank for the world's most benchmarked index currently hovers around the 97th percentile, meaning the S&P 500 exceeded 97% of all other closing values over the last two years. Conversely, the Bloomberg Spot Commodity Index ranks in the 5th percentile, ranking lower than 95% of all closing values over the previous two years.
The prior instance when the rank for stocks rose into the 95th percentile as the commodity index fell into the 5th percentile occurred in 2013, which turned out to be an excellent period for stocks, notwithstanding minor pullbacks until the index finally succumbed to a more pronounced correction in August 2015, two years after the initial divergence. That correction was a growth scare, not a recession.
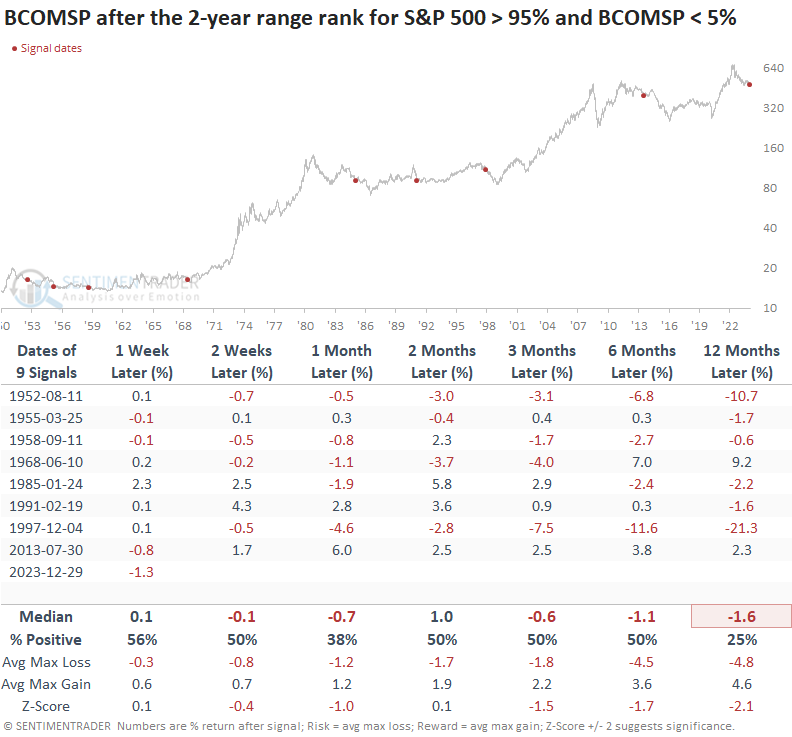
Comparable divergences suggest the downtrend in commodities persists
Whenever the 2-year range rank for the S&P 500 exceeded the 95th percentile as the rank for the Bloomberg Spot Commodity index simultaneously fell below the 5th percentile, the commodity index showed negative returns and unfavorable win rates across almost all time horizons.
Except for 1991, the first signal was consistently accompanied by additional alerts, indicating a persistent downtrend in commodities.
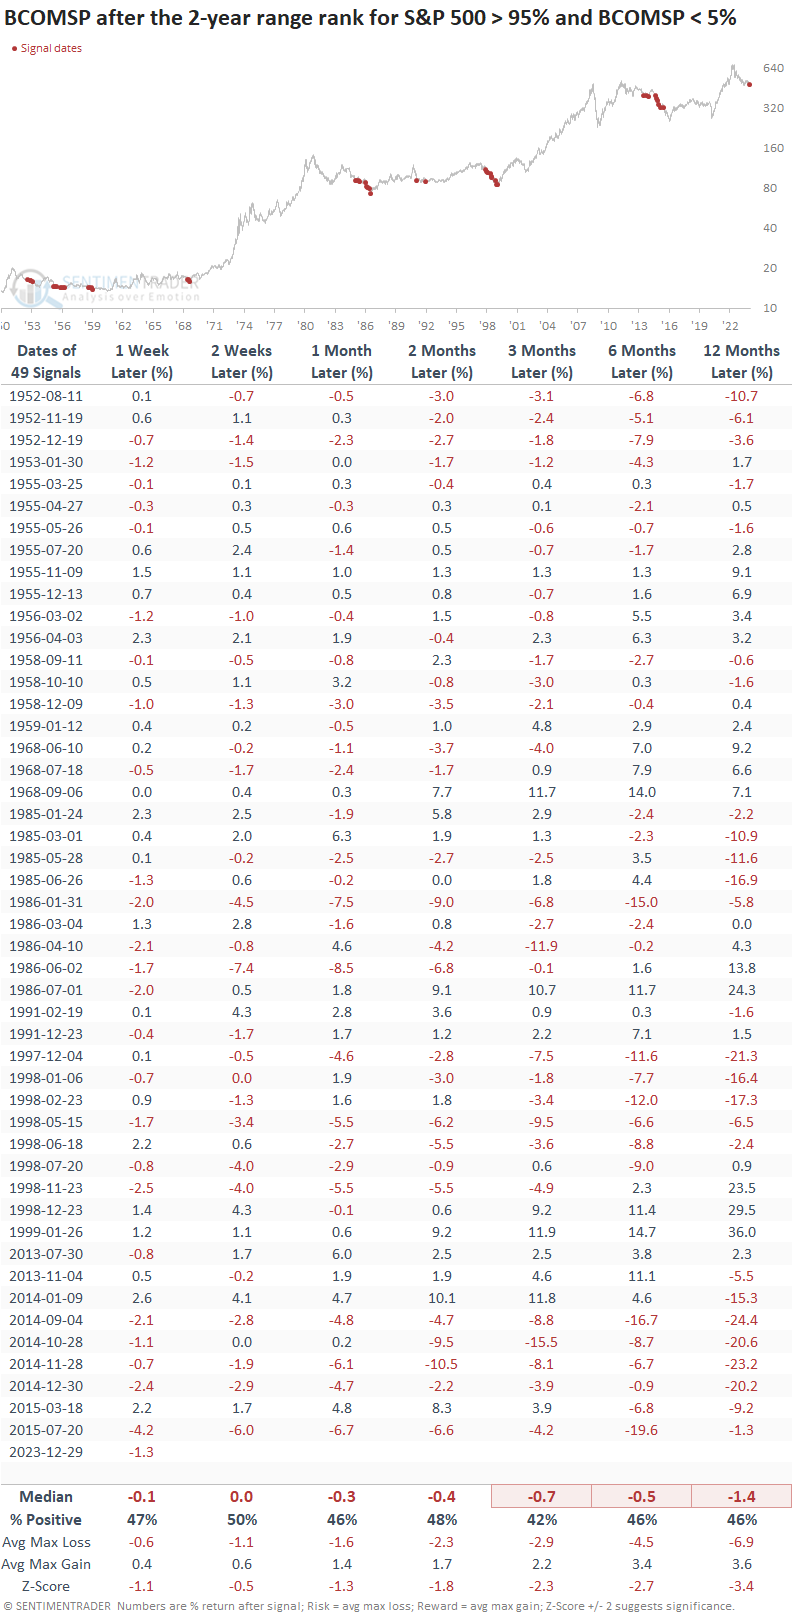
I screened out repeats by identifying the first signal in a month.
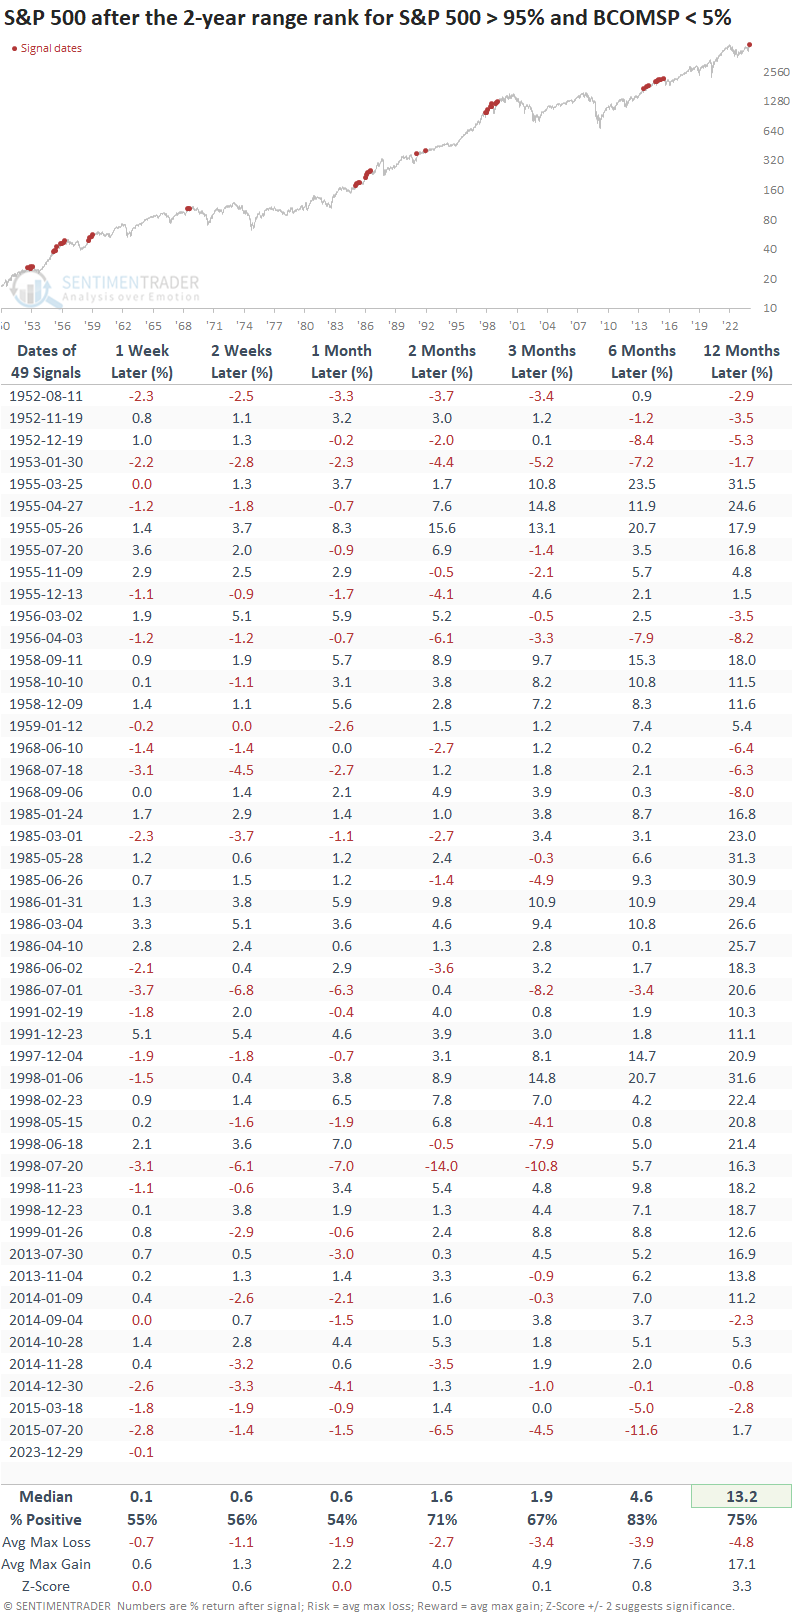
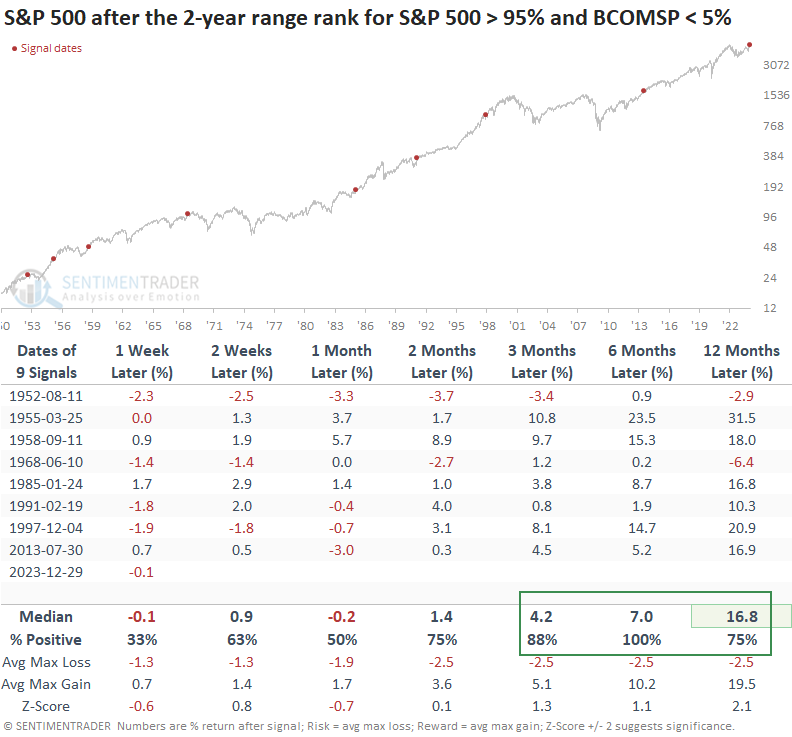
What about stocks?
The divergence between stocks and commodities did not foreshadow doom and gloom for the S&P 500, with the index showing an upward bias over the subsequent year. And, the world's most benchmarked index avoided a loss of greater than -10 % over the following six- and twelve-month horizons in all but one precedent.
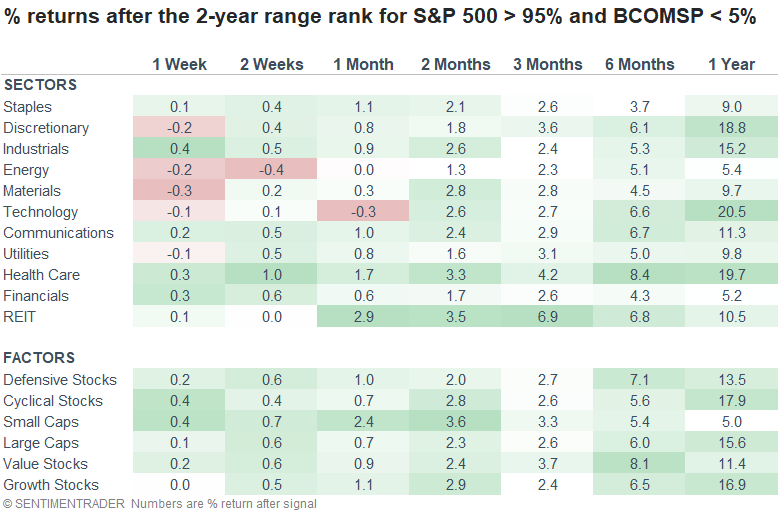
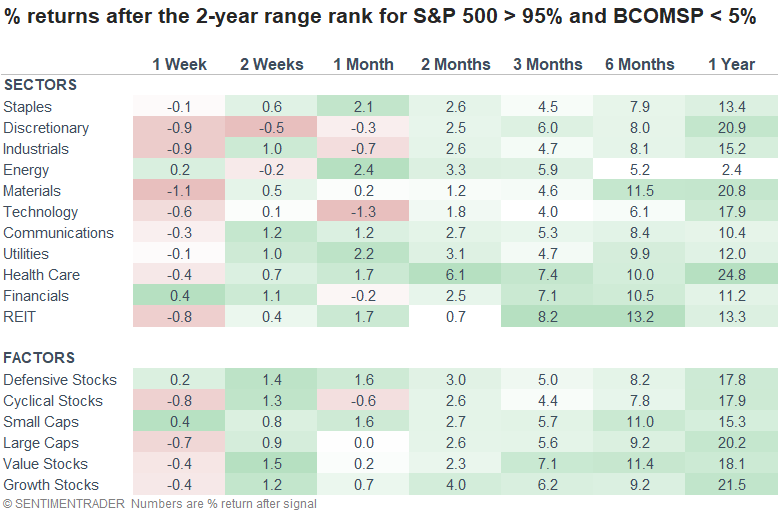
Relative outperformance favored growth-oriented groups like Consumer Discretionary, Technology, and Health Care over the following year. Not surprisingly, commodity-based groups like Energy and Materials encountered difficulties amidst a prevailing downtrend in commodity prices.
An additional tidbit on the energy sector as it relates to commodity trends
Since 1952, whenever the Bloomberg Spot Commodity index closed above its 200-day average, signaling an uptrend, the energy sector delivered an annual return of 14.2%. Conversely, during a downtrend in commodities, like now, energy stocks exhibited a more modest return of 6.2%. So, it helps to know whether you have a commodity headwind or tailwind at your back when investing in the energy sector.
Context similar to now
Suppose I use a reset condition to identify the first signal for context similar to now. In that case, the outlook for commodities remained challenging, especially a year later.
Although the S&P 500's near-term outlook is uninspiring, the prospects brighten considerably over the subsequent three, six, and twelve months.
While forward returns for sectors mirror the patterns observed in the initial study, favoring growth stocks, Materials, a commodity-oriented sector, demonstrate notably more robust performance over the next six and twelve months. Once again, Energy showed abysmal relative performance over the subsequent year.
When should we be concerned about the economic message from stocks and commodities?
A high 2-year range rank spread between stocks and commodities is less likely to signal an imminent recession. However, caution is warranted when the differential falls to a low level. i.e., stocks are low, and commodities are high relative to their respective ranges.
What the research tells us...
The S&P 500 is trading at the upper end of its 2-year range as a commodity index hovers near the lower end of its respective range, creating one of the widest divergences in history. As usual, the perpetual bearish crowd will highlight this disparity, asserting that stocks have veered away from economic reality and commodities are right about an impending recession and bear market in equities. History suggests otherwise. After similar 2-year range rank divergences, stocks tended to move higher over the subsequent year, especially after the first instance. And the threat of recession is less likely when the spread is high versus low. From a sector perspective, growth-oriented stocks displayed solid relative performance trends, while commodity-based groups warrant caution.