Products
SentimenTrader Trading Tools
‍
Backtest Engine
My Trading Toolkit
Correlation Analysis
Seasonality
Indicators & Data API
‍
Proprietary Indicators & Charts
Market Data API
Strategies & Scanner
‍
50+ Trading Strategies
Smart Stock Scanner
Research Reports
‍
Research Solutions
Reports Library
Free Resources
Simple Backtest Calculator
Simple Seasonality Calculator
The Kelly Criterion Calculator
Sentiment Geo Map
Public Research Reports
Pricing
Company
About
In the News
Testimonials
Client Success Stories
Contact
Log inLoginSign up
< BACK TO ALL REPORTS

A historic collapse in the yield curve

Dean Christians
2023-01-09
The 10-year to 3-month Treasury yield spread contracted by one of the most significant amounts in history over the last four days, inverting the curve to a level not seen since 1981. After similar yield spread dynamics, stocks struggled.

Key points:

  • The 10-year to 3-month Treasury yield spread contracted by -54 bps in four days
  • After similar downticks, stocks were negative across most time frames
  • The four-day slump pushed the overall spread to -102 bps, which ranks in the 1st percentile
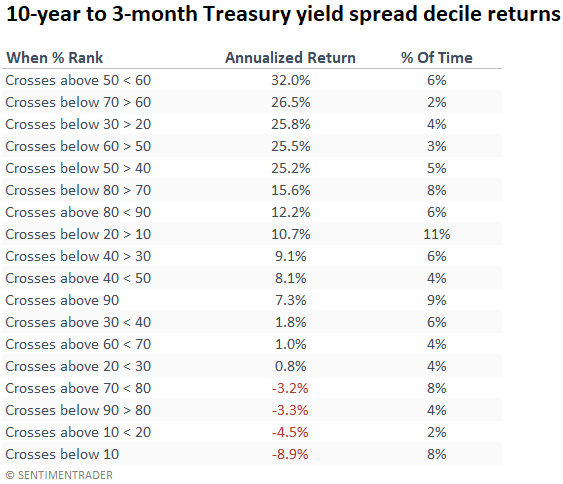
  • Historical yield spread rankings in the 10th percentile or less suggest unfavorable stock returns

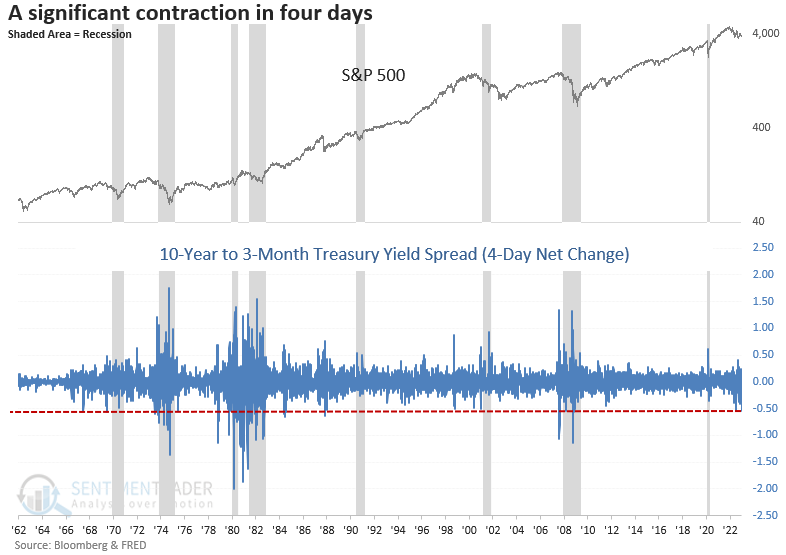
The yield curve continues to flash warning signs

Bond traders wasted no time in the new year bidding up the 10-year bond price in the holiday-shortened first week of the year. The increase in price means the bond yield declined, and in doing so, the widely followed 10-year to 3-month Treasury yield spread contracted by -54 bps in four days.

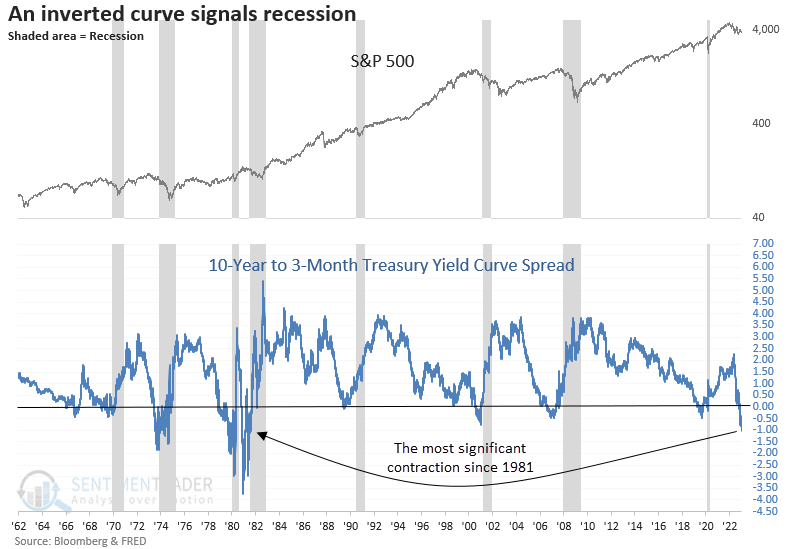
The decline in the spread inverted the yield curve to a historic -102 bps, which ranks in the 1st percentile relative to all other readings since 1962.

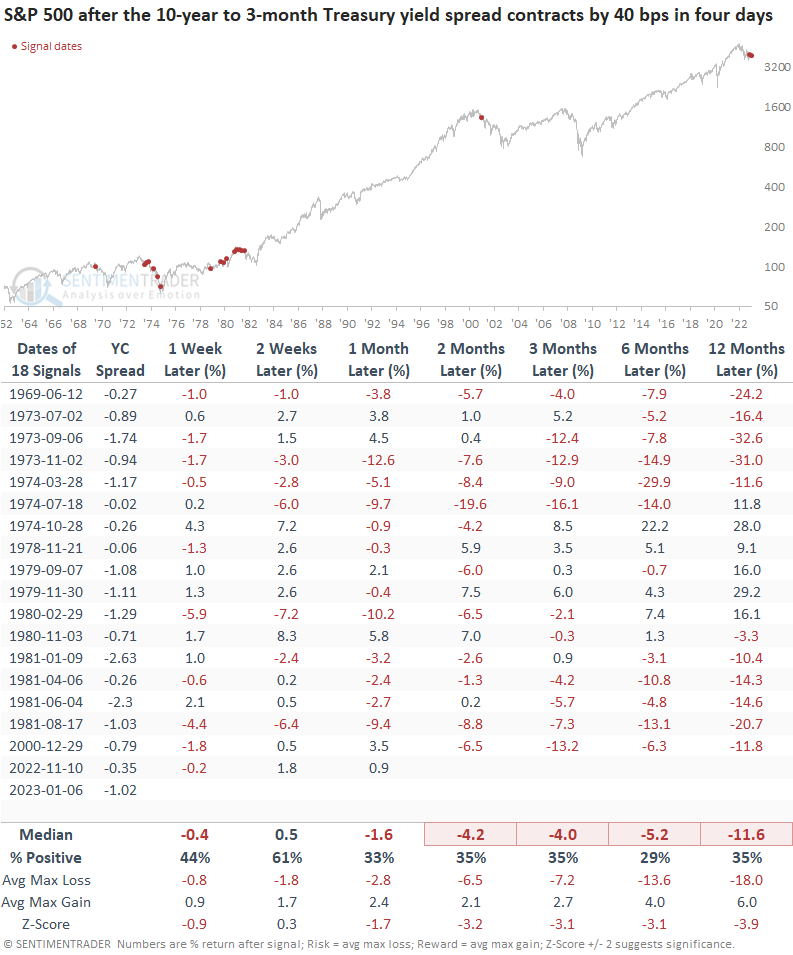
Let's assess the outlook for stocks when the 4-day net change in the 10-year to 3-month Treasury yield curve contracts by -40 bps. I loosened the net change level to capture more historical instances. And for context, I will identify signals that occurred when the curve was inverted, which is the case now. 

Similar sharp contractions preceded negative returns for the S&P 500

When the Treasury yield spread declines by -40 bps in four days, and the spread is inverted, the outlook for the S&P 500 is grim across most time frames. Historical signals typically occur within the context of stock market drawdowns, especially during the 1966-82 secular bear market period when the Federal Reserve was fighting elevated inflation similar to the current environment.

With the Treasury yield spread falling to the lowest level since 1981, we need to consider the 1966-82 secular period in terms of similar analogs for the current environment. If the Federal Reserve remains higher for longer and the economy softens further, the yield spread can fall further. 

When I assess the 10-year to 3-month Treasury yield spread relative to all other historical levels, the spread ranks in the 1st percentile, which means 99% of all other readings are higher.

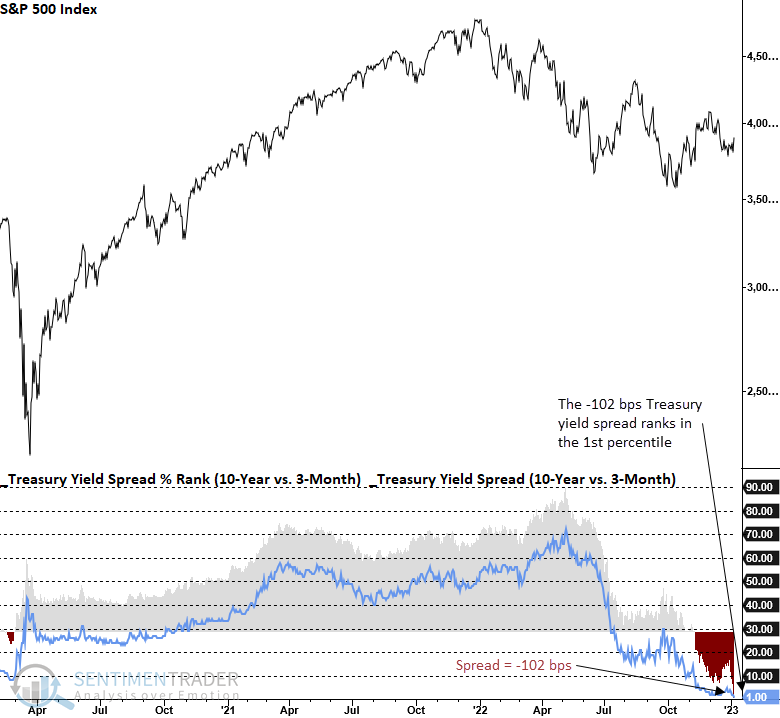
The Treasury yield spread crossed below the 10th percentile in November 2022. After similar decile bracket signals, the S&P 500 annualized at -8.9%, the worst return for any yield spread shift. And, should the curve steepen from here and cross above the 10th percentile, returns remain unfavorable.

What the research tells us...

Whether a sharp four-day contraction or a historic inversion, one must be mindful of the top-down macro environment as the yield curve continues to flash warning signs for stocks and the economy. Interestingly, economist Campbell Harvey, a pioneer in the research of the yield curve, was interviewed this morning on CNBC. Mr. Harvey said it's different this time as other factors don't point to an economic contraction. i.e., the curve is sending a false signal, and there will be no recession. We agree with Mr. Harvey on one thing. A research approach that weighs multiple factors is more desirable than depending on a single indicator. 

Sorry, you don't have access to this report

Upgrade your subscription plan to get access
Go to Dasboard
PRODUCTS
SentimenTrader
Trading Tools
Indicators & Data API
‍
Strategies & Scanner
‍
Research Reports
FREE
RESOUrCES
Simple Backtest
Calculator
Simple Seasonality
Calculator
The Kelly Criterion
Calculator
Sentiment Geo Map
‍
Public Research Reports
‍
Pricing
Bundle pricing
‍
Announcements
‍
FAQ
COMPANY
‍
About
‍
In the News
‍
Testimonials
‍
Client Success Stories
CONTACT
‍
General Inquiries
‍
Media Inquiries
‍
Financial Professionals Inquiries
‍
© 2025 Sundial Capital Research Inc. All rights reserved.
Setsail Marketing
TermsPrivacyAffiliate Program
Risk Disclosure: Futures and forex trading contains substantial risk and is not for every investor. An investor could potentially lose all or more than the initial investment. Risk capital is money that can be lost without jeopardizing ones’ financial security or life style. Only risk capital should be used for trading and only those with sufficient risk capital should consider trading. Past performance is not necessarily indicative of future results.

Hypothetical Performance Disclosure: Hypothetical performance results have many inherent limitations, some of which are described below. No representation is being made that any account will or is likely to achieve profits or losses similar to those shown; in fact, there are frequently sharp differences between hypothetical performance results and the actual results subsequently achieved by any particular trading program. One of the limitations of hypothetical performance results is that they are generally prepared with the benefit of hindsight. In addition, hypothetical trading does not involve financial risk, and no hypothetical trading record can completely account for the impact of financial risk of actual trading. for example, the ability to withstand losses or to adhere to a particular trading program in spite of trading losses are material points which can also adversely affect actual trading results. There are numerous other factors related to the markets in general or to the implementation of any specific trading program which cannot be fully accounted for in the preparation of hypothetical performance results and all which can adversely affect trading results.

Testimonial Disclosure: Testimonials appearing on this website may not be representative of other clients or customers and is not a guarantee of future performance or success.