Data &
Technology
Research
Reports
Report Solutions
Reports Library
Actionable
Strategies
Free
Resources
Simple Backtest Calculator
Simple Seasonality Calculator
The Kelly Criterion Calculator
Sentiment Geo Map
Public Research Reports
Free Webinar
Pricing
Company
About
Meet Our Team
In the News
Testimonials
Client Success Stories
Contact
Log inLoginSign up
< BACK TO ALL REPORTS

A historic 7 days as sentiment plunges

Jason Goepfert
2020-03-04
The past 7 days have seen historic volatility in the S&P 500, with four shocking declines. Optimism has plunged over the past two weeks.

Historic 7-day whips

The past 7 sessions have seen some of the wildest swings since the inception of S&P 500 futures in 1982.

All but one of the days saw an intraday high or low that was around 3% or more from the prior day’s close, averaging nearly 3.4%. Only the most wicked swings in the past 40 years can match it.

Most of these moves have been to the downside, with 4 of the days suffering a decline of at least 3 standard deviations. This is tied for the tightest cluster of "shocking" losses in history.

3 standard deviation losses

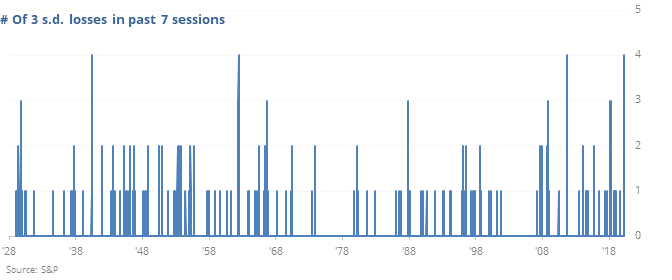
This kind of volatility is extremely uncomfortable, especially for newer investors. And there’s no telling if it’s going to morph into something more serious. The only consistent thing that behavior like this has meant in the past was that we typically saw prices work higher over the medium-term.


Sentiment plunge

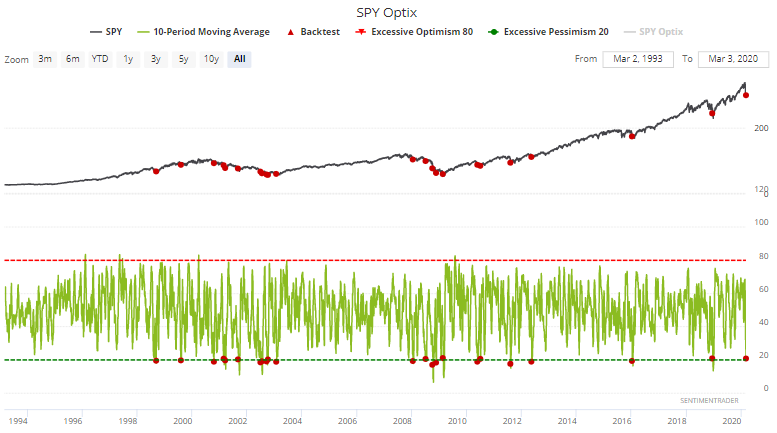
The stock market's wild intraday swings are normal. Very rarely does the market crash and then make a V-shaped recovery. Short term sentiment readings are fluctuating with these daily price movements, but when we apply a 10 day moving average to various sentiment readings, sentiment remains extremely low.

For example, SPY Optix's 10 dma has fallen below 21:

S&P optimism index


Excluding overlapping signals, this was mostly bullish for the S&P 500 2 months later, with a median gain of +5.29%:

Optimism index very low

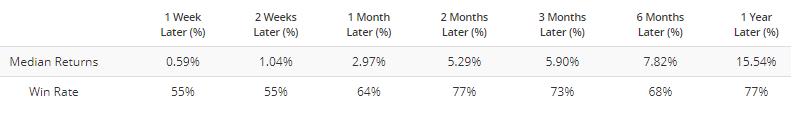
According to our Backtest Engine, returns were even better if SPY's 200-day average was sloping higher like it is now.

This is an abridged version of our recent reports and notes. For immediate access with no obligation, sign up for a 30-day free trial now.

We also looked at:

  • The 7-day range in S&P 500 futures is at a historic high
  • What happens to various markets after emergency Fed rate cuts
  • Commodity trend-followers have had a heck of a good week
  • Looking at extremes in our Optimism Indexes for sectors and bonds and overseas markets
  • The airline index has recorded one of its most oversold readings ever
DATA &
TECHnologies
IndicatorEdge
‍
BackTestEdge
‍
Other Tools
‍
DataEdge API
RESEARCH
reports
Research Solution
‍
Reports Library
‍
actionable
Strategies
Trading Strategies
‍
Smart Stock Scanner
‍
FREE
RESOUrCES
Simple Backtest
Calculator
Simple Seasonality
Calculator
The Kelly Criterion
Calculator
Sentiment Geo Map
‍
Public Research Reports
‍
Free Webinar
COMPANY
‍
About
‍
Meet our Team
‍
In the News
‍
Testimonials
‍
Client Success Stories
Pricing
Bundle pricing
‍
Announcements
‍
FAQ
© 2024 Sundial Capital Research Inc. All rights reserved.
Setsail Marketing
TermsPrivacyAffiliate Program
Risk Disclosure: Futures and forex trading contains substantial risk and is not for every investor. An investor could potentially lose all or more than the initial investment. Risk capital is money that can be lost without jeopardizing ones’ financial security or life style. Only risk capital should be used for trading and only those with sufficient risk capital should consider trading. Past performance is not necessarily indicative of future results.

Hypothetical Performance Disclosure: Hypothetical performance results have many inherent limitations, some of which are described below. No representation is being made that any account will or is likely to achieve profits or losses similar to those shown; in fact, there are frequently sharp differences between hypothetical performance results and the actual results subsequently achieved by any particular trading program. One of the limitations of hypothetical performance results is that they are generally prepared with the benefit of hindsight. In addition, hypothetical trading does not involve financial risk, and no hypothetical trading record can completely account for the impact of financial risk of actual trading. for example, the ability to withstand losses or to adhere to a particular trading program in spite of trading losses are material points which can also adversely affect actual trading results. There are numerous other factors related to the markets in general or to the implementation of any specific trading program which cannot be fully accounted for in the preparation of hypothetical performance results and all which can adversely affect trading results.

Testimonial Disclosure: Testimonials appearing on this website may not be representative of other clients or customers and is not a guarantee of future performance or success.